

Question: Click here for the Excel Data File begin{tabular}{|c|c|} hline A & B begin{tabular}{|c|} Demand (dozens) end{tabular} & RelativeFrequency hline 19 & 0.04
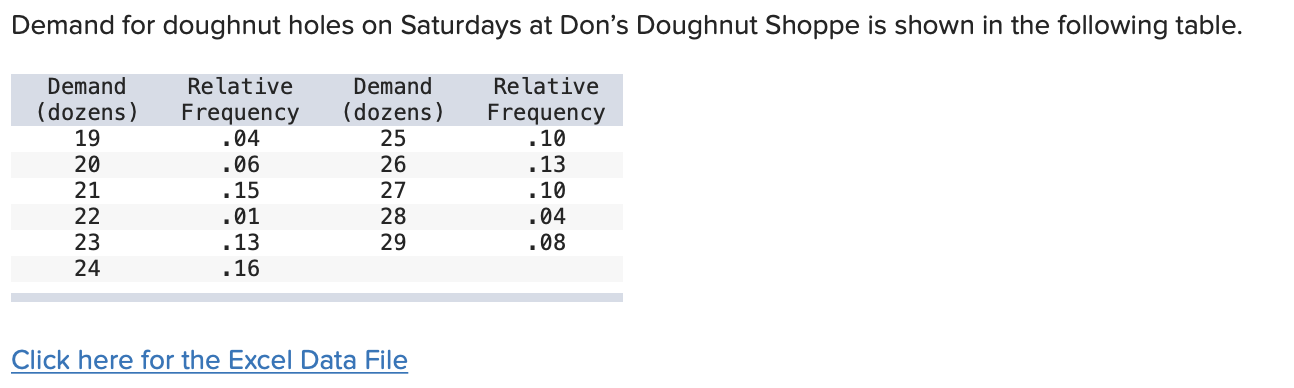
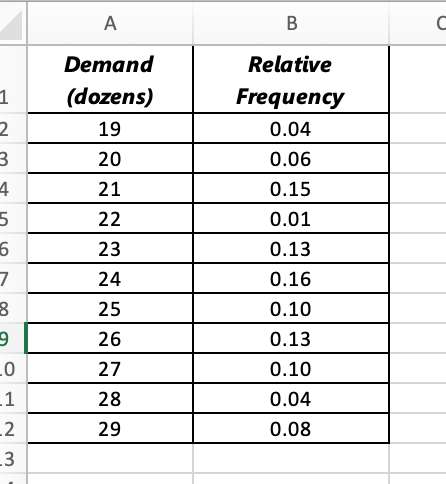
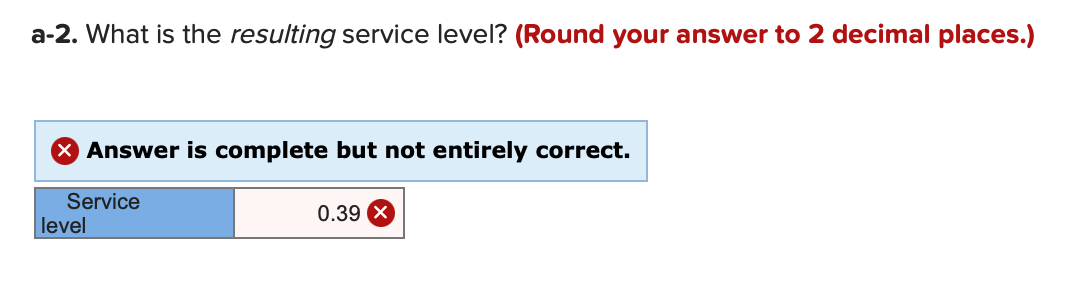
Click here for the Excel Data File \begin{tabular}{|c|c|} \hline A & B \\ \begin{tabular}{|c|} Demand \\ (dozens) \end{tabular} & RelativeFrequency \\ \hline 19 & 0.04 \\ \hline 20 & 0.06 \\ \hline 21 & 0.15 \\ \hline 22 & 0.01 \\ \hline 23 & 0.13 \\ \hline 24 & 0.16 \\ \hline 25 & 0.10 \\ \hline 26 & 0.13 \\ \hline 27 & 0.10 \\ \hline 28 & 0.04 \\ \hline 29 & 0.08 \\ \hline \end{tabular} a-2. What is the resulting service level? (Round your answer to 2 decimal places.) Answer is complete but not entirely correct
Step by Step Solution
There are 3 Steps involved in it
1 Expert Approved Answer
Step: 1 Unlock

Question Has Been Solved by an Expert!
Get step-by-step solutions from verified subject matter experts
Step: 2 Unlock
Step: 3 Unlock