

Question: & Click here for the Excel Data Set C. Answer the following questions. (a) Using Data Set C, fill in the missing data. Note: Round
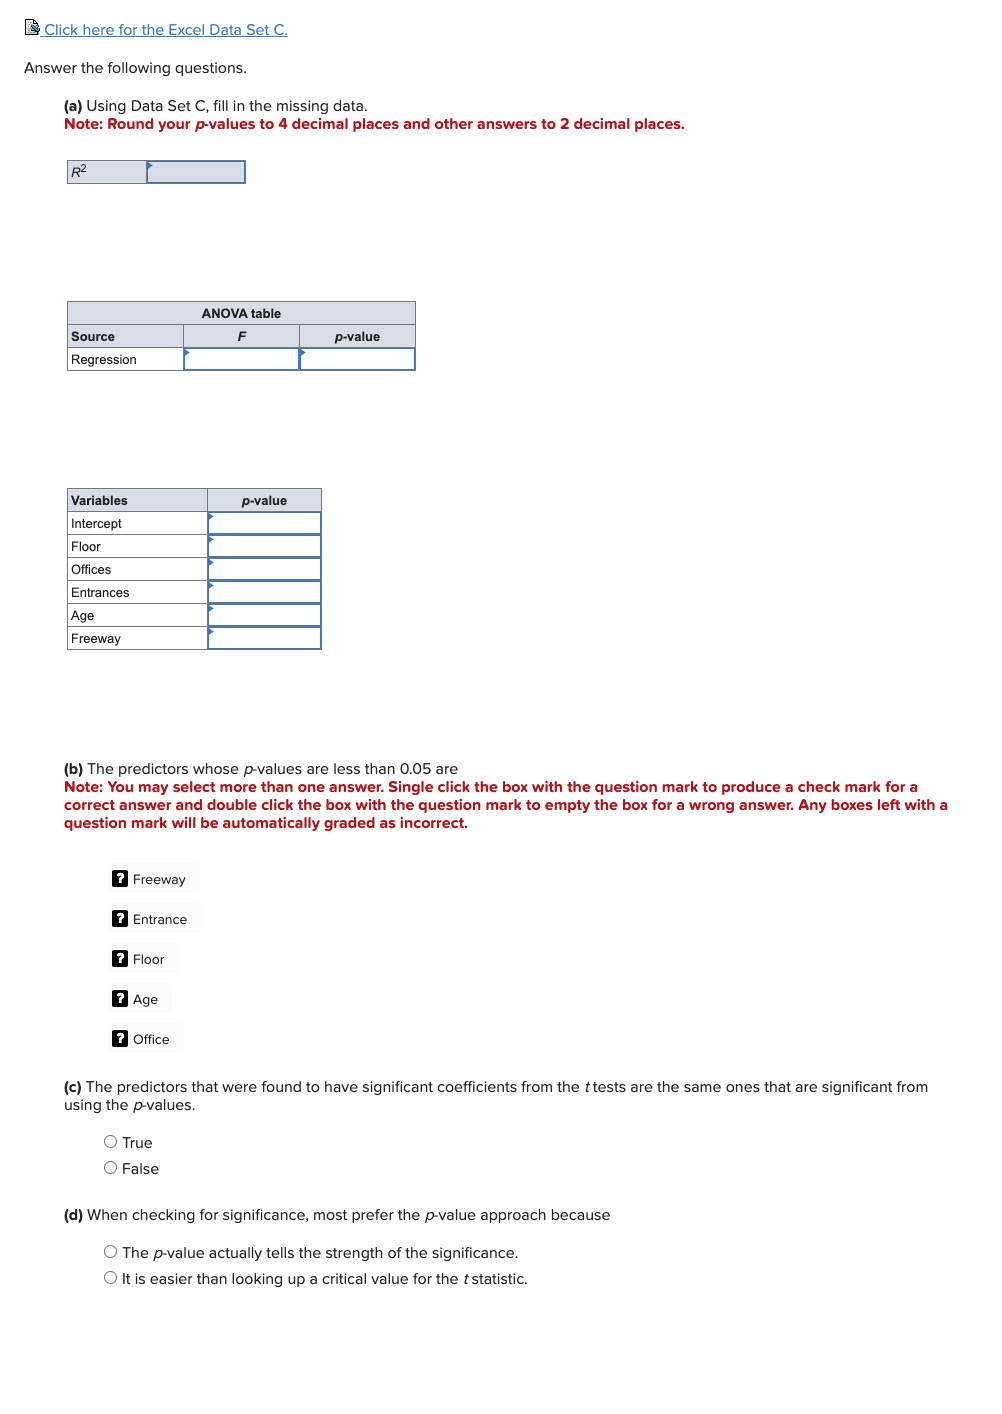
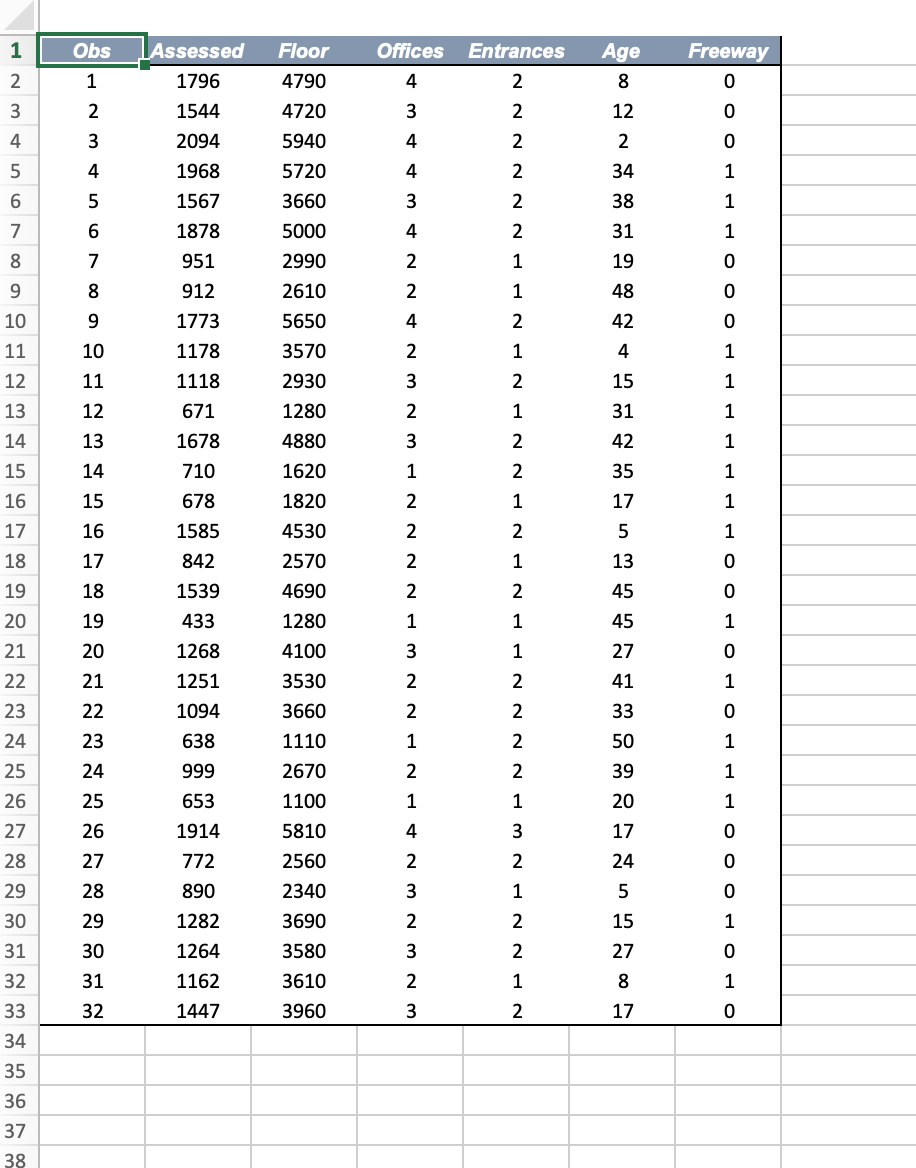
& Click here for the Excel Data Set C. Answer the following questions. (a) Using Data Set C, fill in the missing data. Note: Round your p-values to 4 decimal places and other answers to 2 decimal places. R T ] ANOVA table Source F p-value Regression Variables p-value Intercept Floor Offices Entrances Age Freeway (b) The predictors whose p-values are less than 0.05 are Note: You may select more than one answer. Single click the box with the question mark to produce a check mark for a correct answer and double click the box with the question mark to empty the box for a wrong answer. Any boxes left with a question mark will be automatically graded as incorrect. n Freeway Entrance n Floor E Age Office (c) The predictors that were found to have significant coefficients from the ttests are the same ones that are significant from using the p-values. O True O False (d) When checking for significance, most prefer the p-value approach because O The p-value actually tells the strength of the significance. O It is easier than looking up a critical value for the statistic. Obs Assessed Floor Offices Entrances Age Freeway 1796 4790 4 8 1544 4720 12 2094 5940 2 34 OUT A 1968 5720 VOUDAWN 1567 3660 1878 5000 8 951 2990 8 912 2610 10 9 1773 5650 11 10 1178 3570 12 11 1118 2930 13 12 671 1280 14 13 1678 4880 15 14 710 1620 16 15 678 1820 17 16 1585 4530 O H O H O O O H H H O P O H O O H H H H H H H O O O H H HOOD N I N N P N W P N N N N H P N P N P N N H N P N PA NN NNNN WNWNWNAHNANNWANNNNHWNWNANNAWADW. 18 17 842 2570 19 18 1539 4690 20 19 433 1280 21 20 1268 4100 22 21 1251 3530 23 22 1094 3660 24 23 638 1110 25 24 999 2670 26 25 653 1100 27 26 1914 5810 28 27 772 2560 29 28 890 2340 30 29 1282 3690 31 30 1264 3580 32 31 1162 3610 33 32 1447 3960 34 35 36 37 38
Step by Step Solution
There are 3 Steps involved in it

Get step-by-step solutions from verified subject matter experts