

Question: Click here to view the data table. Click here to view the table of critical values of the correlation coefficient. n 3 0.997 X 0.950
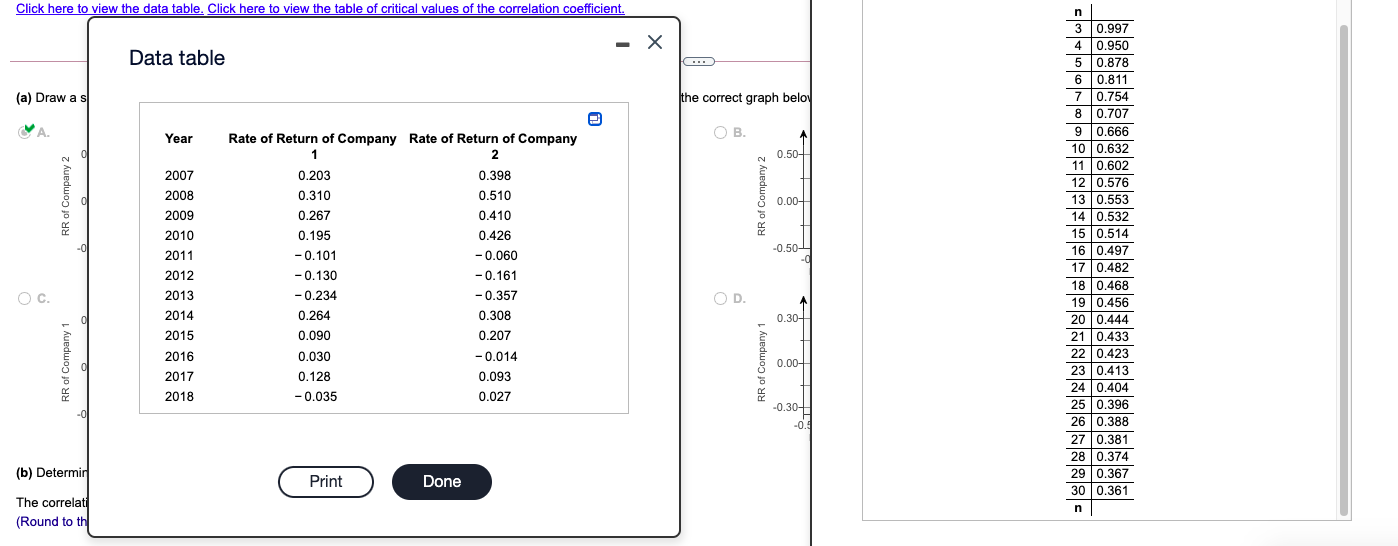
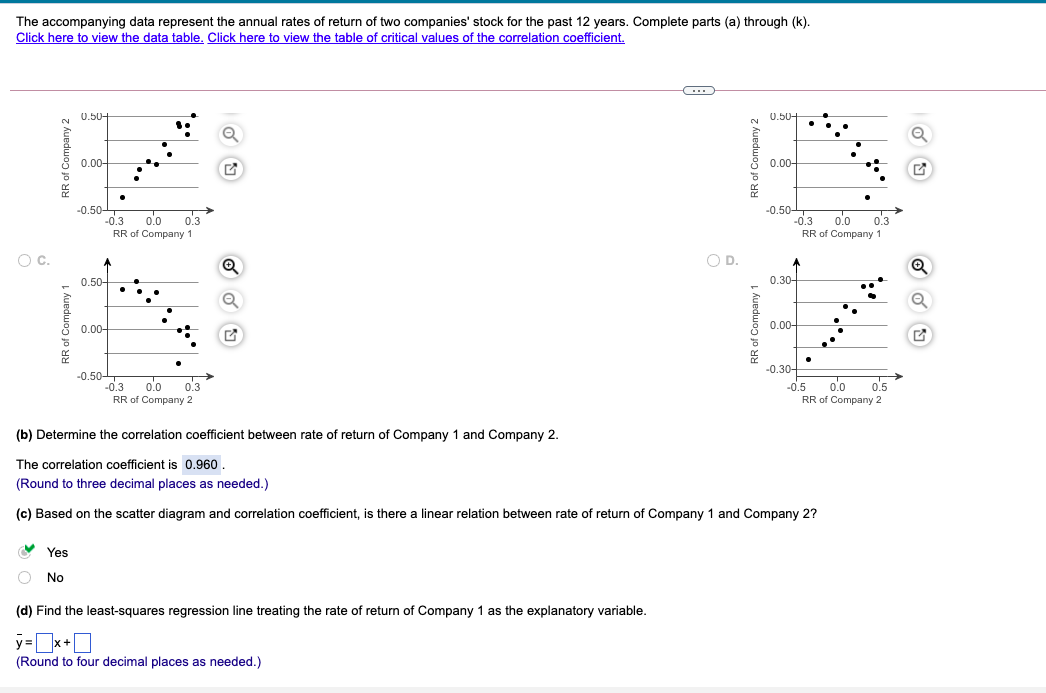
Click here to view the data table. Click here to view the table of critical values of the correlation coefficient. n 3 0.997 X 0.950 Data table 5 0.878 6 0.811 (a) Draw a s the correct graph belo 7 0.754 0.707 Year Rate of Return of Company Rate of Return of Company O B. 9 0.666 2 0.50- 10 0.632 11 0.602 2007 0.203 0.398 12 0.576 2008 0.310 0.510 RR of Company 2 RR of Company 2 0.00- 13 0.553 2009 0.267 0.410 14 0.532 2010 0.195 0.426 15 0.514 -0 2011 - 0.101 - 0.060 -0.50- 16 0.497 2012 - 0.130 -0.161 17 0.482 18 0.468 O C. 2013 - 0.234 - 0.357 O D. 19 0.456 2014 0.264 0.308 0.30- 20 0.444 2015 0.090 0.207 21 0.433 2016 0.030 - 0.014 22 0.423 RR of Company 1 RR of Company 1 0 0.00- 2017 0.128 0.093 23 0.413 24 0.404 2018 - 0.035 0.027 25 0.396 -0 -0.30 26 0.388 27 0.381 28 0.374 (b) Determin Print Done 29 0.367 30 0.361 The correlati n (Round to thThe accompanying data represent the annual rates of return of two companies' stock for the past 12 years. Complete parts (a) through (k). Click here to view the data table. Click here to view the table of critical values of the correlation coefficient. 0.50 U.50+ RR of Company 2 RR of Company 2 0.00- 0.OO- -0.50- -0.50- 0.3 0.0 0.3 0.3 0.0 0.3 RR of Company 1 RR of Company 1 O C. O D. 0.50 0.30- RR of Company 1 RR of Company 1 0.00- 0.00 -0.30- -0.50- 0.3 0.0 0.3 0.5 0.0 0.5 RR of Company 2 RR of Company 2 (b) Determine the correlation coefficient between rate of return of Company 1 and Company 2. The correlation coefficient is 0.960 . (Round to three decimal places as needed.) (c) Based on the scatter diagram and correlation coefficient, is there a linear relation between rate of return of Company 1 and Company 2? Yes O No (d) Find the least-squares regression line treating the rate of return of Company 1 as the explanatory variable. y = [* +0 (Round to four decimal places as needed.)
Step by Step Solution
There are 3 Steps involved in it

Get step-by-step solutions from verified subject matter experts