

Question: Click on the datafile logo to reference the data. DATA f 2 ile a . Select a scatter diagratn with Admit Rate ( % )
Click on the datafile logo to reference the data.
DATA ile
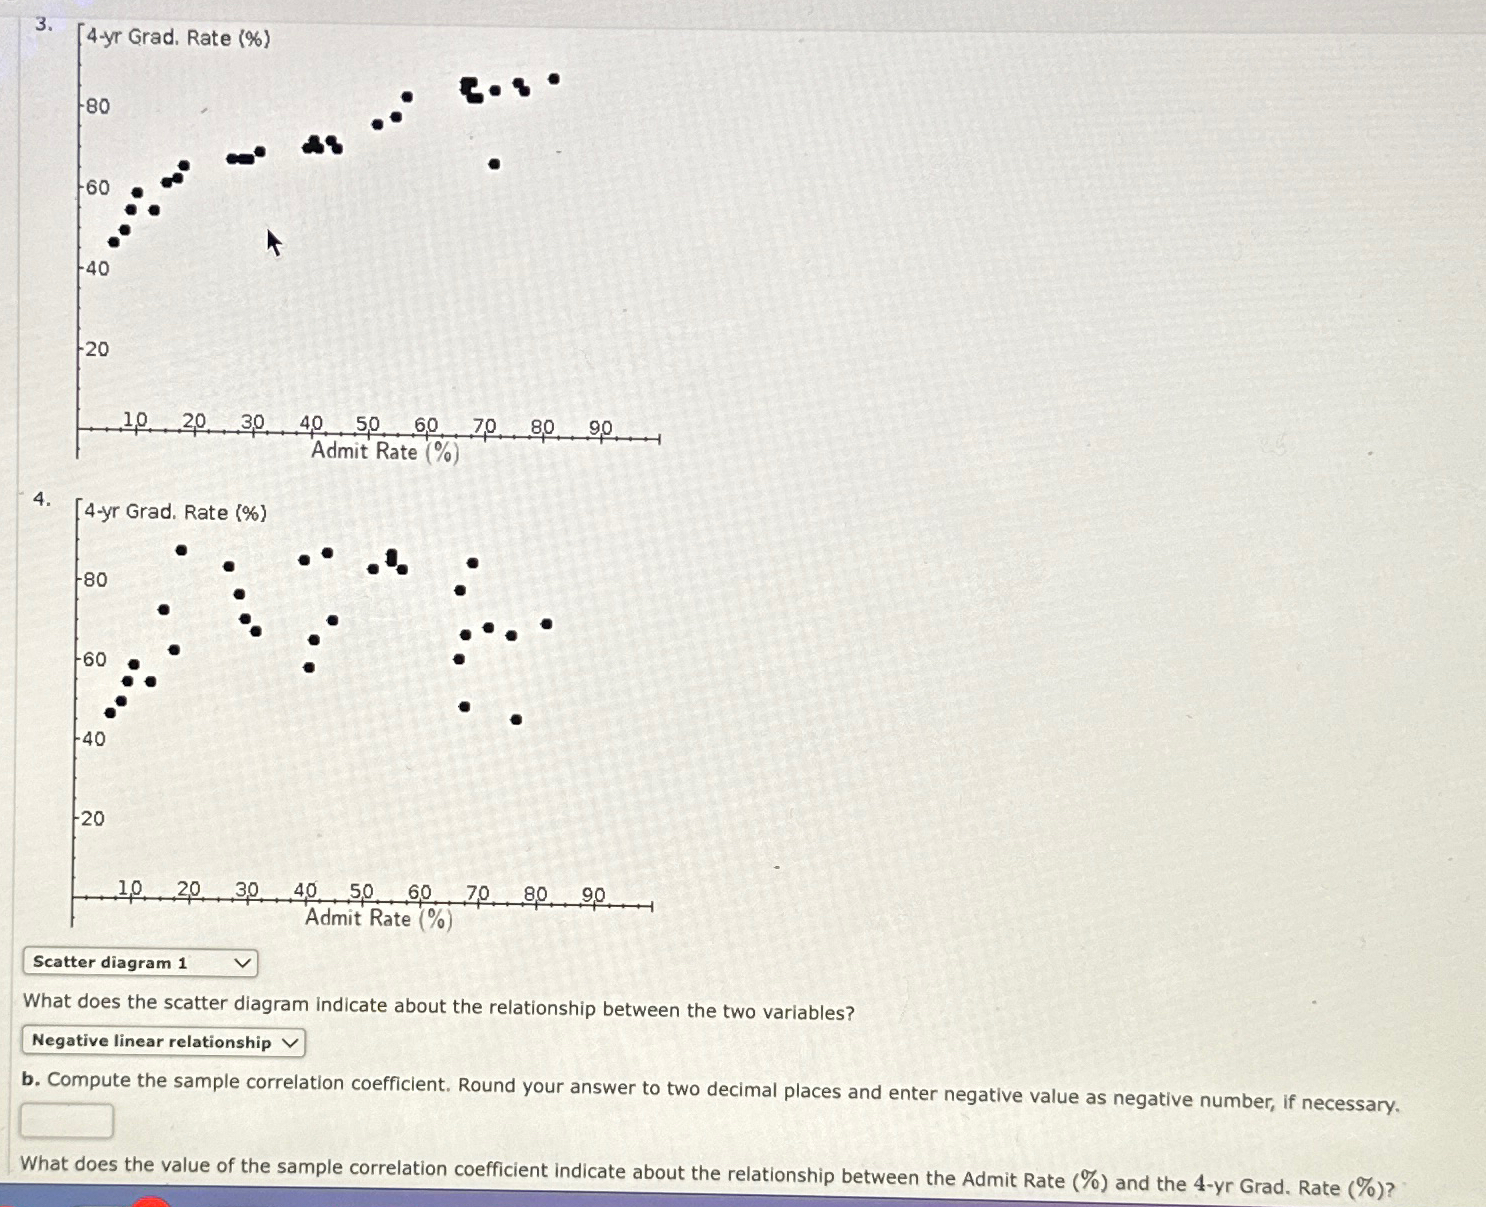
a Select a scatter diagratn with Admit Rate as the independent variable.
Scatter diagram
What does the scatter diagram indicate about the relationship between the two variables?
Negative linear relationship
b Compute the sample correlation coefficient. Round your answer to two decimal places and enter negative value as negative number, if necessary.
What does the value of the sample correlation coefficient indicate about the relationship between the Admit Rate and the yr Grad. Rate
Step by Step Solution
There are 3 Steps involved in it
1 Expert Approved Answer
Step: 1 Unlock

Question Has Been Solved by an Expert!
Get step-by-step solutions from verified subject matter experts
Step: 2 Unlock
Step: 3 Unlock