

Question: Click on the graph to plot a point. Click a point to delete it. 10 70 O 6 5 4 2 1 2 3 5

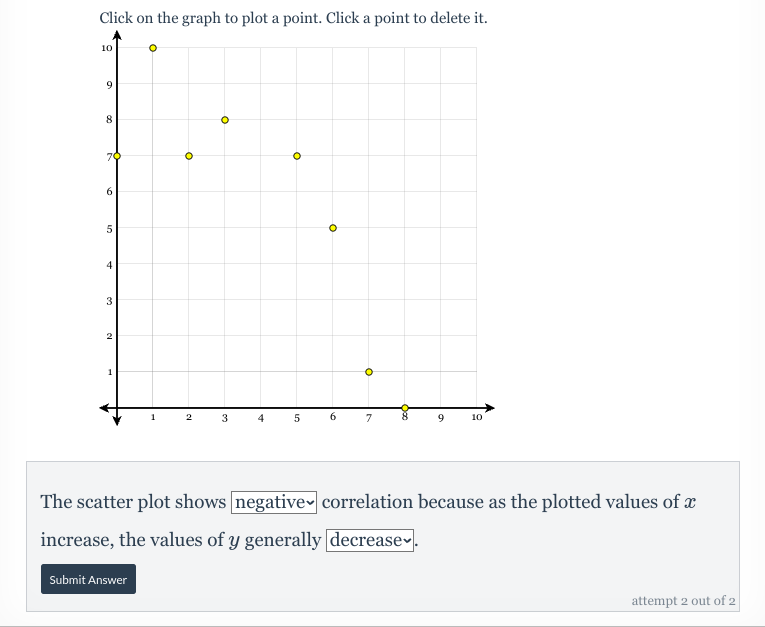
Click on the graph to plot a point. Click a point to delete it. 10 70 O 6 5 4 2 1 2 3 5 7 9 10 The scatter plot shows negative correlation because as the plotted values of a increase, the values of y generally decrease. Submit Answer attempt 2 out of 2
Step by Step Solution
There are 3 Steps involved in it
1 Expert Approved Answer
Step: 1 Unlock

Question Has Been Solved by an Expert!
Get step-by-step solutions from verified subject matter experts
Step: 2 Unlock
Step: 3 Unlock