

Question: Click on the table icon : that shows the fixed costs, variable costs, and total costs for different output levels. Then use this data to

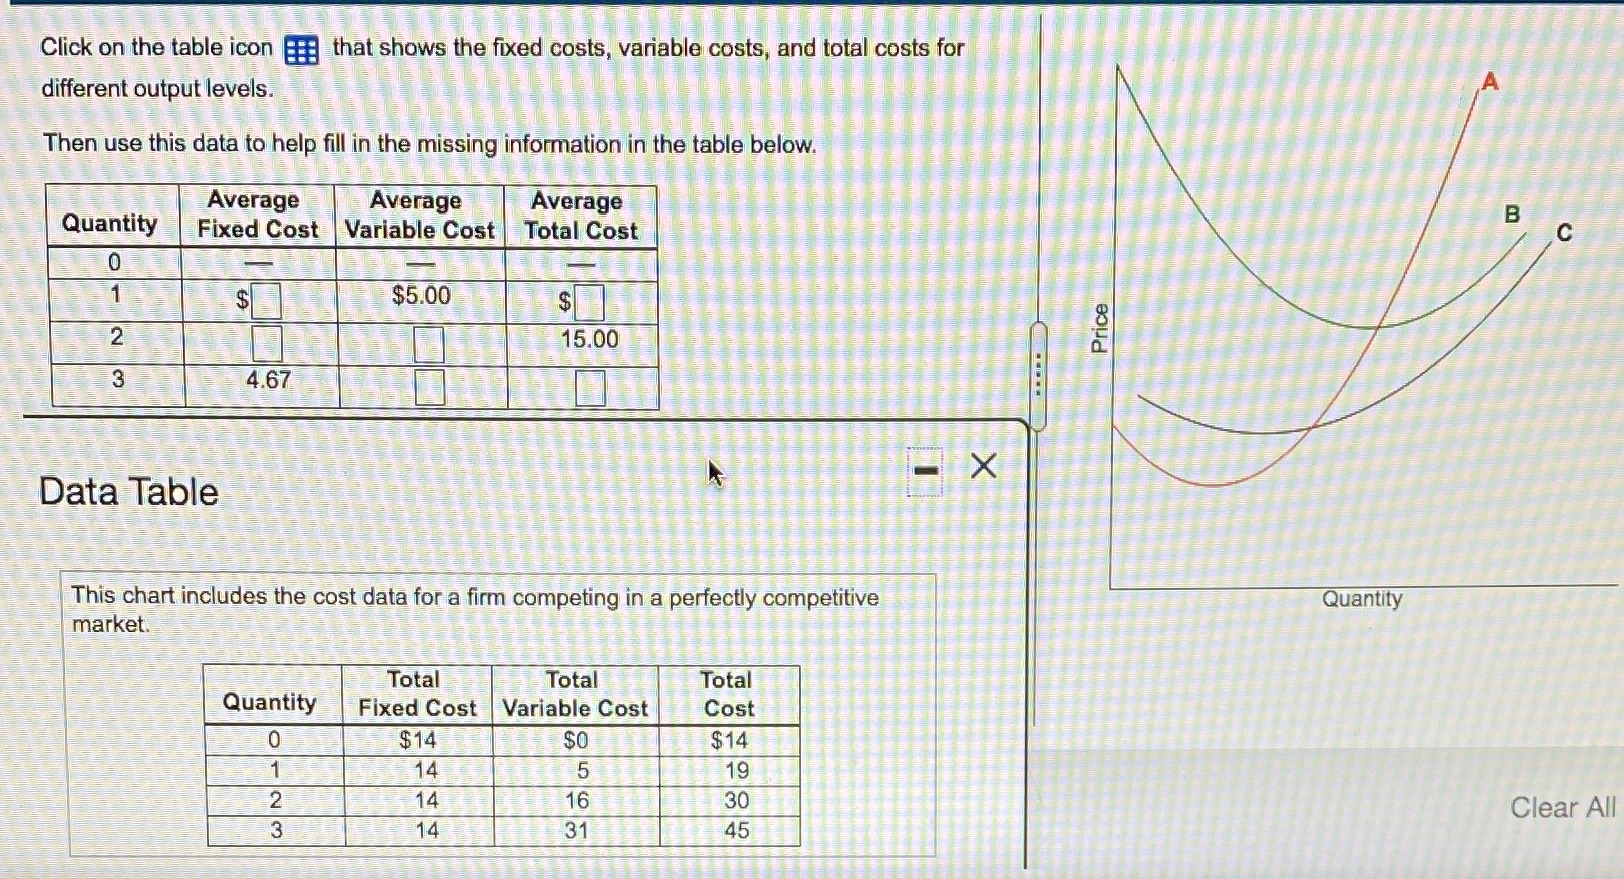
Click on the table icon : that shows the fixed costs, variable costs, and total costs for different output levels. Then use this data to help fill in the missing information in the table below. Average Average Average Quantity B Fixed Cost Variable Cost Total Cost C 0 $ $5.00 $ Price 2 15.00 4.67 X Data Table This chart includes the cost data for a firm competing in a perfectly competitive Quantity market. Total Total Total Quantity Fixed Cost Variable Cost Cost 0 $14 $0 $14 14 5 19 14 16 30 Clear All 14 31 45
Step by Step Solution
There are 3 Steps involved in it
1 Expert Approved Answer
Step: 1 Unlock

Question Has Been Solved by an Expert!
Get step-by-step solutions from verified subject matter experts
Step: 2 Unlock
Step: 3 Unlock