

Question: Click the icon to view the additional information.) The 2024 income statement and comparative balance sheet of Rolling Hills, Inc. follow: (Click the icon to
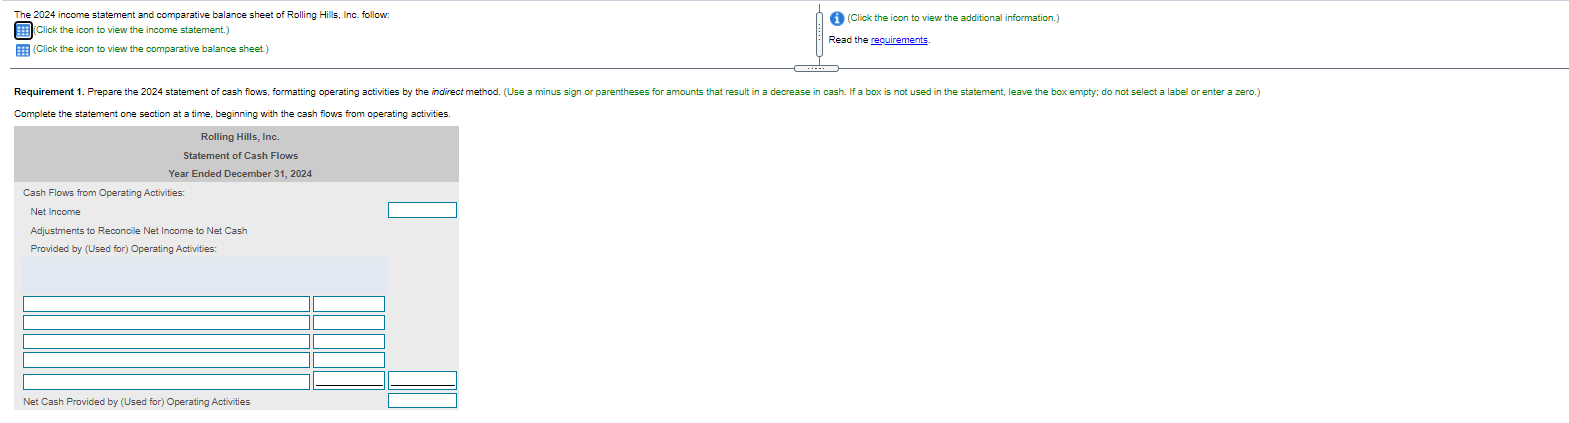
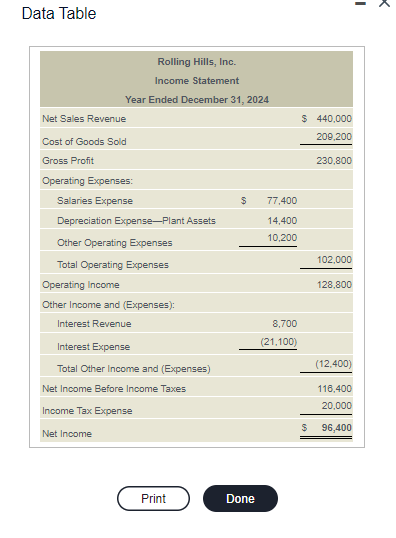
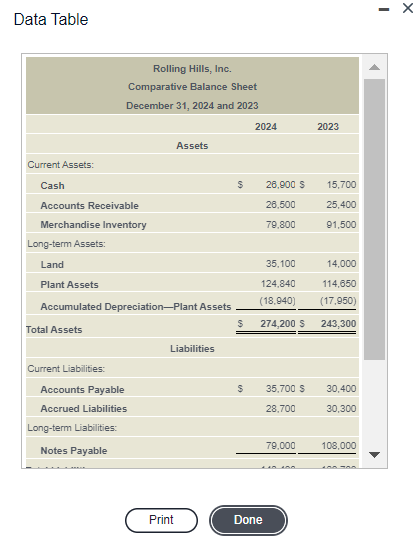
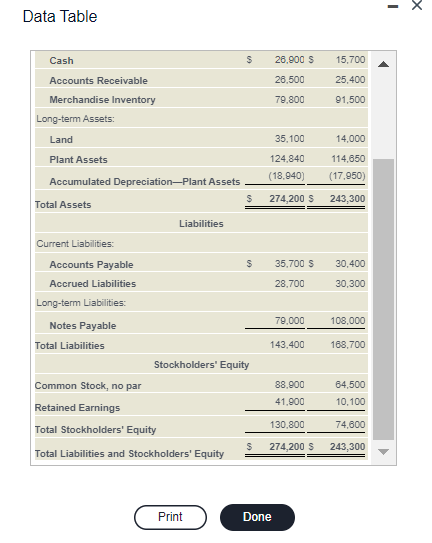
Click the icon to view the additional information.) The 2024 income statement and comparative balance sheet of Rolling Hills, Inc. follow: (Click the icon to view the income statement.) (Click the icon to view the comparative balance sheet) Read the requirements Requirement 1. Prepare the 2024 statement of cash flows, formatting operating activities by the indirect method. (Use a minus sign or parentheses for amounts that result in a decrease in cash. If a box is not used in the statement, leave the box empty: do not select a label or enter a zero.) Complete the statement one section at a time, beginning with the cash flows from operating activities. Rolling Hills, Inc. Statement of Cash Flows Year Ended December 31, 2024 Cash Flows from Operating Activities: Net Income Adjustments to Reconcile Net Income to Net Cash Provided by (Used for) Operating Activities: Net Cash Provided by (Used for) Operating Activities - Data Table Rolling Hills, Inc. Income Statement Year Ended December 31, 2024 Net Sales Revenue $ 440,000 Cost of Goods Sold 209,200 Gross Profit 230.800 Operating Expenses Salaries Expense 77,400 Depreciation ExpensePlant Assets 14,400 10,200 Other Operating Expenses 102,000 Total Operating Expenses Operating Income 128,800 Other Income and (Expenses): Interest Revenue 8,700 Interest Expense (21,100) Total Other Income and (Expenses) (12.400) Net Income Before Income Taxes 116,400 20,000 Income Tax Expense $ 96,400 Net Income Print Done Data Table Rolling Hills, Inc. Comparative Balance Sheet December 31, 2024 and 2023 2024 2023 Assets $ 26,900 $ Current Assets: Cash Accounts Receivable Merchandise Inventory Long-term Assets: 15,700 25.400 26.500 79,800 91,500 Land 35.100 14,000 124,840 (18,940) 114,650 (17.950) S 274,200 $ 243,300 Plant Assets Accumulated DepreciationPlant Assets Total Assets Liabilities Current Liabilities Accounts Payable Accrued Liabilities Long-term Liabilities: S 35,700 S 30,400 28.700 30,300 Notes Payable 79,000 108,000 Print Done - X Data Table S 26,900 $ 15.700 26,500 25,400 Cash Accounts Receivable Merchandise Inventory Long-term Assets 79,800 91,500 Land 35.100 14,000 124,840 (18,940) 114,650 (17.950) Plant Assets Accumulated DepreciationPlant Assets Total Assets Liabilities S 274,200 $ 243,300 Current Liabilities: S 35,700 S 30,400 28,700 30,300 Accounts Payable Accrued Liabilities Long-term Liabilities: Notes Payable Total Liabilities 79.000 108,000 143.400 168,700 Stockholders' Equity 88.900 64,500 10.100 41.900 Common Stock, no par Retained Earnings Total Stockholders' Equity Total Liabilities and Stockholders' Equity 130.800 74,600 $ 274,200 S 243,300 Print Done
Step by Step Solution
There are 3 Steps involved in it

Get step-by-step solutions from verified subject matter experts