

Question: Click the icon to view the data table. (a) Construct a frequency marginal distribution. X1 X2 X3 Marginal distribution 1 30 25 30 Y2
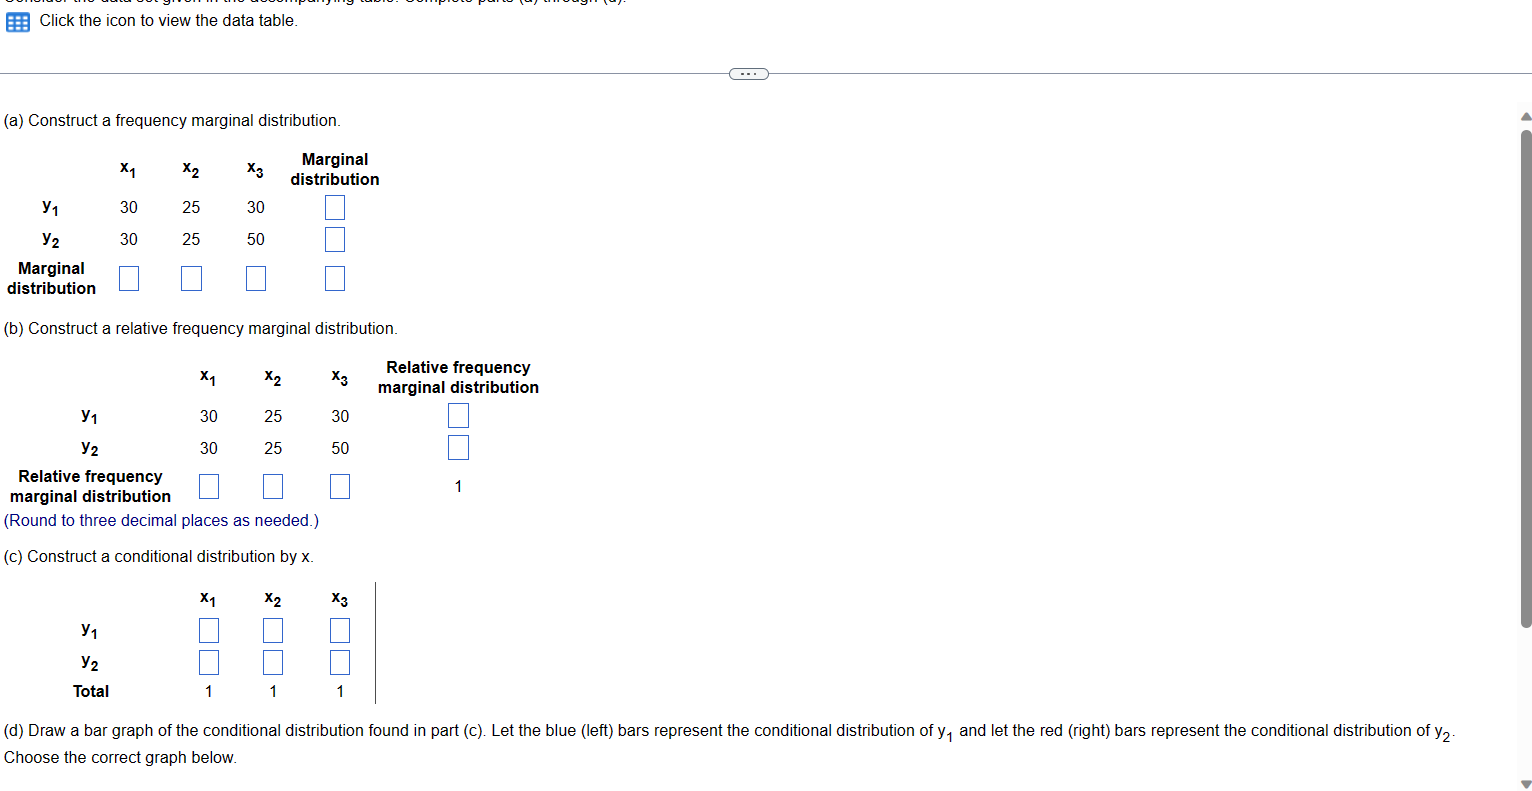
Click the icon to view the data table. (a) Construct a frequency marginal distribution. X1 X2 X3 Marginal distribution 1 30 25 30 Y2 30 25 50 Marginal distribution (b) Construct a relative frequency marginal distribution. X1 X2 X3 1 30 25 Y2 30 25 Relative frequency marginal distribution 30 50 (Round to three decimal places as needed.) (c) Construct a conditional distribution by x. Relative frequency marginal distribution X2 X3 2 - 1 1 - 1 1 (d) Draw a bar graph of the conditional distribution found in part (c). Let the blue (left) bars represent the conditional distribution of y and let the red (right) bars represent the conditional distribution of y Choose the correct graph below. 1 2 Total X1 * -
Step by Step Solution
There are 3 Steps involved in it

Get step-by-step solutions from verified subject matter experts