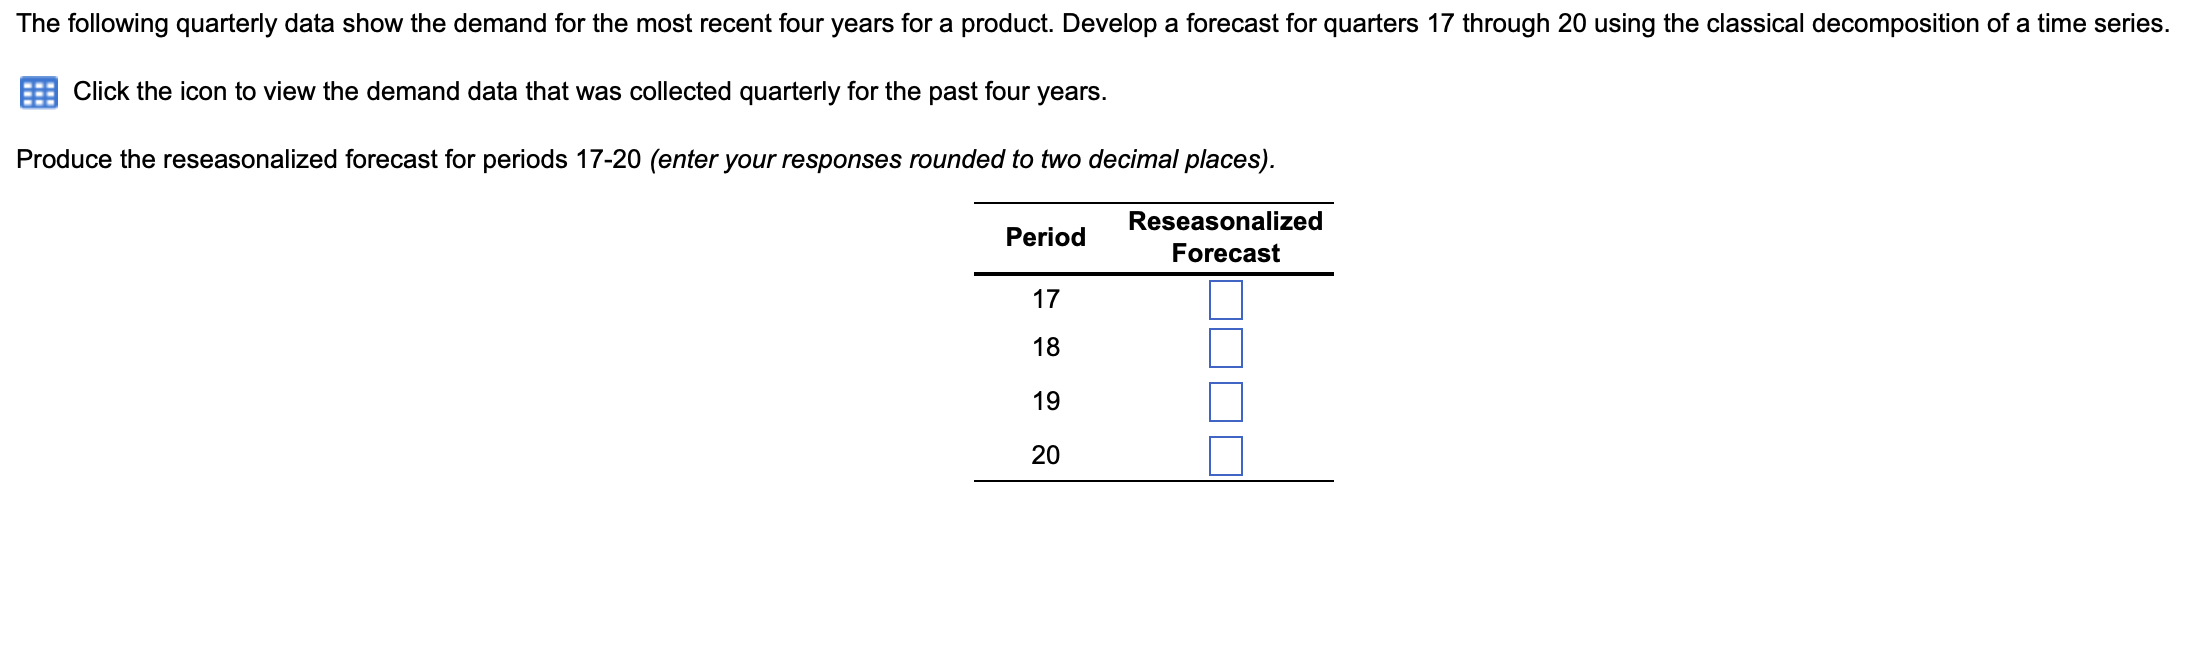
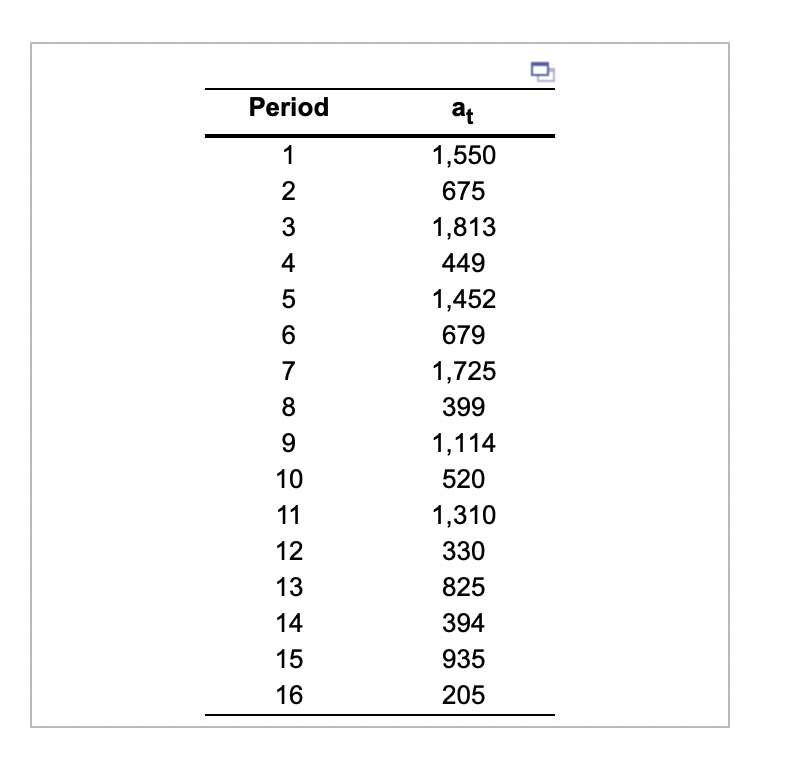
Question: Click the icon to view the demand data that was collected quarterly for the past four years. Produce the reseasonalized forecast for periods 17-20 (enter

Click the icon to view the demand data that wasClick the icon to view the demand data that was

Click the icon to view the demand data that was collected quarterly for the past four years. Produce the reseasonalized forecast for periods 17-20 (enter your responses rounded to two decimal places). \begin{tabular}{cc} \hline Period & at \\ \hline 1 & 1,550 \\ 2 & 675 \\ 3 & 1,813 \\ 4 & 449 \\ 5 & 1,452 \\ 6 & 679 \\ 7 & 1,725 \\ 8 & 399 \\ 9 & 1,114 \\ 10 & 520 \\ 11 & 1,310 \\ 12 & 330 \\ 13 & 825 \\ 14 & 394 \\ 15 & 935 \\ 16 & 205 \\ \hline \end{tabular}

Step by Step Solution

There are 3 Steps involved in it

1 Expert Approved Answer
Step: 1 Unlock blur-text-image
Question Has Been Solved by an Expert!

Get step-by-step solutions from verified subject matter experts

Step: 2 Unlock
Step: 3 Unlock

Students Have Also Explored These Related General Management Questions!