

Question: Click the icon to view the Student Grades data. Choose the correct scatter chart and linear trendline for the data. Click here to view chart
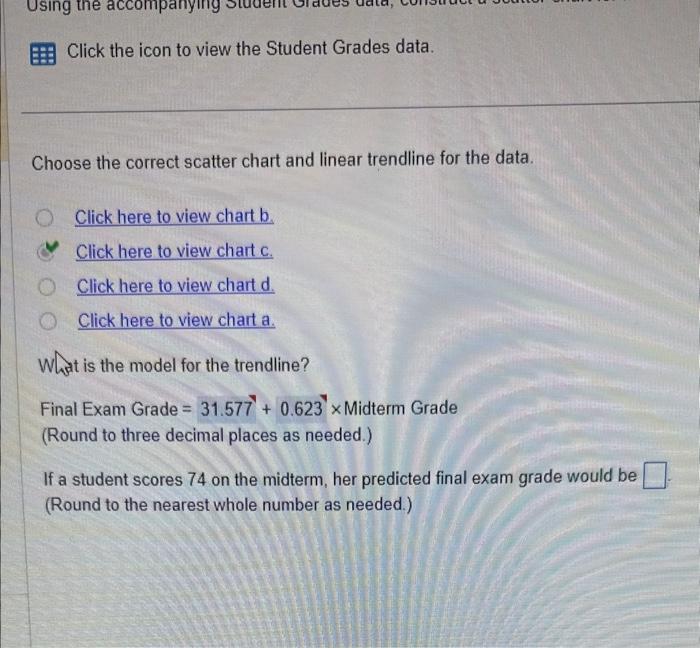
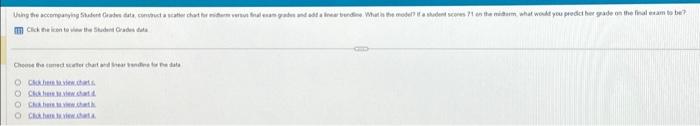
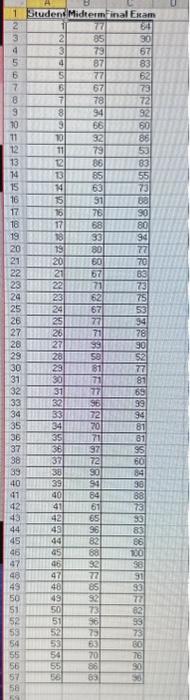
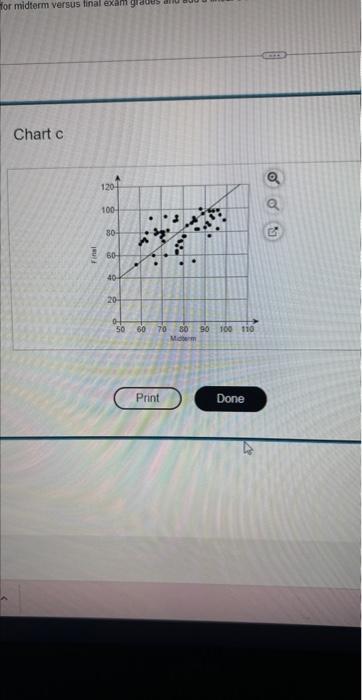
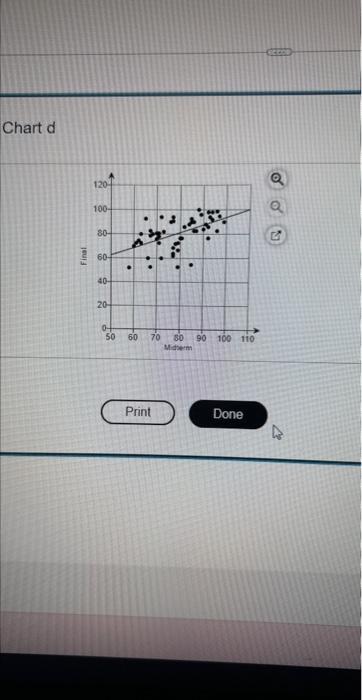
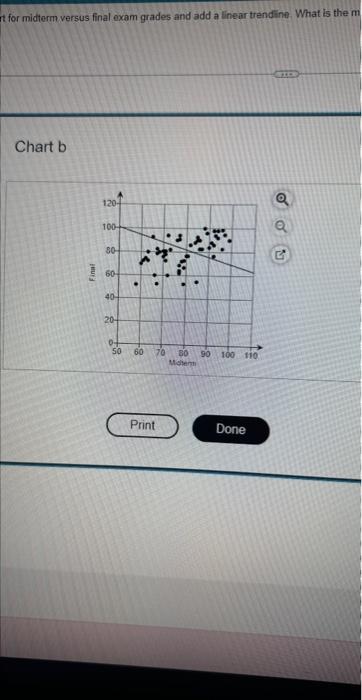
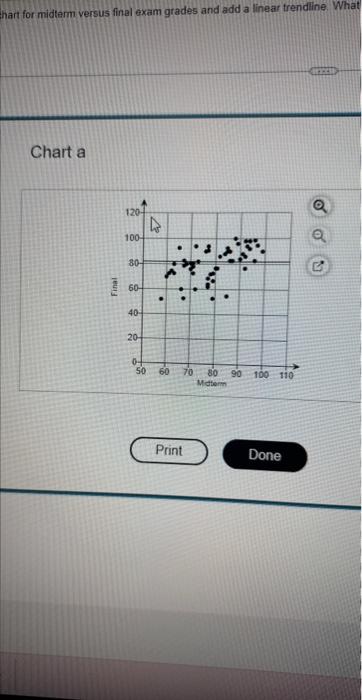
Click the icon to view the Student Grades data. Choose the correct scatter chart and linear trendline for the data. Click here to view chart b. Click here to view chart c. Click here to view chart d. Click here to view chart a. What is the model for the trendline? Final Exam Grade =31.577+0.623 Midterm Grade (Round to three decimal places as needed.) If a student scores 74 on the midterm, her predicted final exam grade would be (Round to the nearest whole number as needed.) Click the irinen te whew He Shudent Crades that CMahtis audenctarth Chatien unverichat 1. iskitheis at rintichth Clochar bievien itats. Chart c Chart d t for midterm versus final exam grades and add a linear trendine. What is the m Chart b thart for midterm versus final exam grades and add a linear trendline. What Chart a Click the icon to view the Student Grades data. Choose the correct scatter chart and linear trendline for the data. Click here to view chart b. Click here to view chart c. Click here to view chart d. Click here to view chart a. What is the model for the trendline? Final Exam Grade =31.577+0.623 Midterm Grade (Round to three decimal places as needed.) If a student scores 74 on the midterm, her predicted final exam grade would be (Round to the nearest whole number as needed.) Click the irinen te whew He Shudent Crades that CMahtis audenctarth Chatien unverichat 1. iskitheis at rintichth Clochar bievien itats. Chart c Chart d t for midterm versus final exam grades and add a linear trendine. What is the m Chart b thart for midterm versus final exam grades and add a linear trendline. What Chart a
Step by Step Solution
There are 3 Steps involved in it

Get step-by-step solutions from verified subject matter experts