

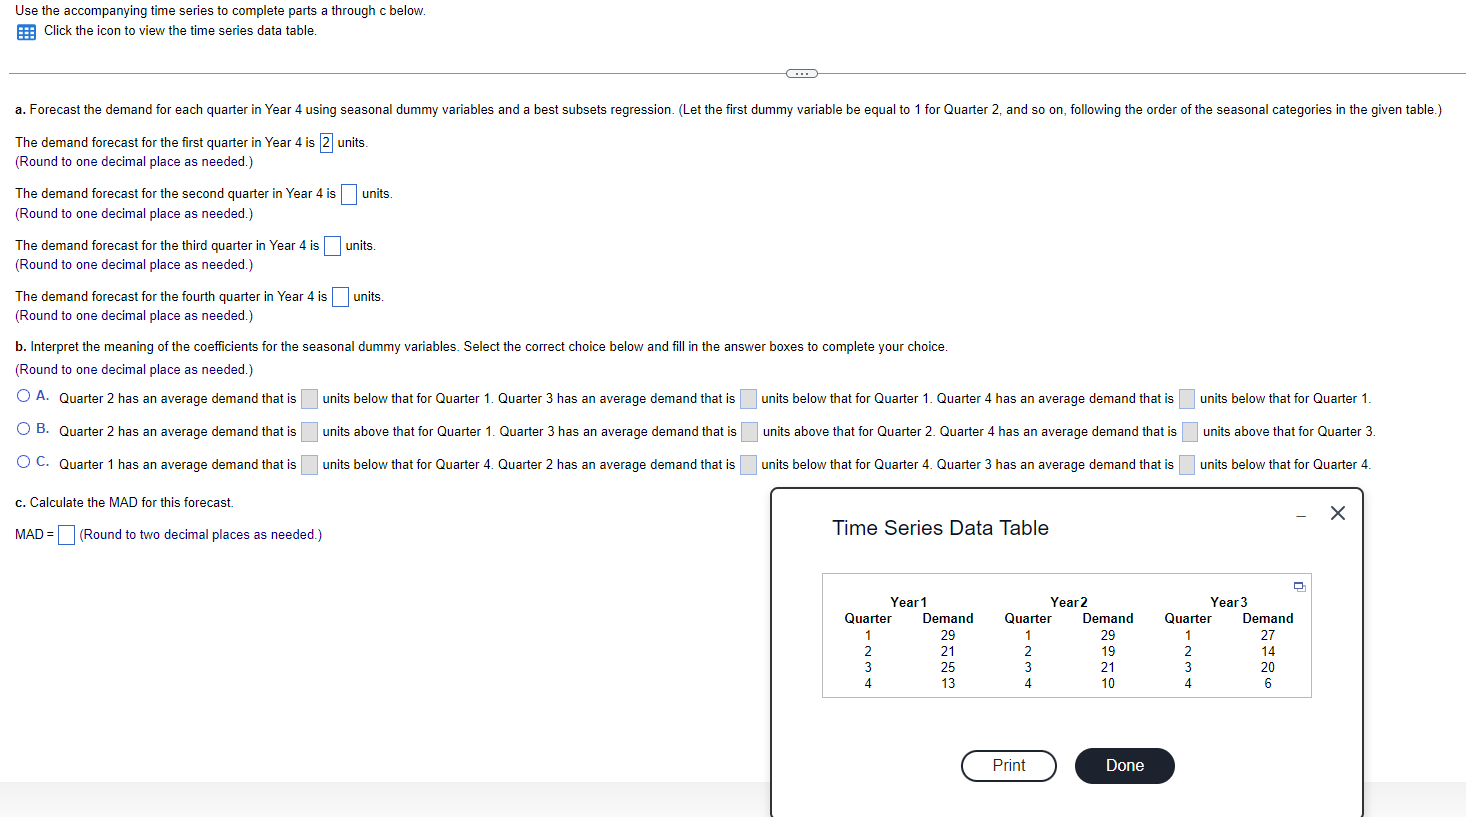
Question: Click the icon to view the time series data table. The demand forecast for the first quarter in Year 4 is units. ( Round to
Click the icon to view the time series data table.
The demand forecast for the first quarter in Year is
units.
Round to one decimal place as needed.
The demand forecast for the second quarter in Year is units.
Round to one decimal place as needed.
The demand forecast for the third quarter in Year is units.
Round to one decimal place as needed.
The demand forecast for the fourth quarter in Year is units.
Round to one decimal place as needed.
b Interpret the meaning of the coefficients for the seasonal dummy variables. Select the correct choice below and fill in the answer boxes to complete your choice.
Round to one decimal place as needed.
A Quarter has an average demand that is
B Quarter has an average demand that is
C Quarter has an average demand that is
units below that for Quarter Quarter has an average demand that is
units below that for Quarter Quarter has an average demand that is
units above that for Quarter Quarter has an average demand that is
units below that for Quarter Quarter has an average demand that is
units below that for Quarter
units above that for Quarter
units below that for Quarter
c Calculate the MAD for this forecast.
MAD Round to two decimal places as needed.
Time Series Data Table
Step by Step Solution
There are 3 Steps involved in it
1 Expert Approved Answer
Step: 1 Unlock

Question Has Been Solved by an Expert!
Get step-by-step solutions from verified subject matter experts
Step: 2 Unlock
Step: 3 Unlock