

Question: Climate Datasets: [Cause] Project; Temps. csy and [Effect] Project; Cherries. csy Hypothesis: Did minimum temperatures in Michigan during a recent period from 2010-2015 have an
![Climate Datasets: [Cause] Project; Temps. csy and [Effect] Project; Cherries. csy](https://s3.amazonaws.com/si.experts.images/answers/2024/06/667aeb9cc2ea5_740667aeb9ca8f30.jpg)
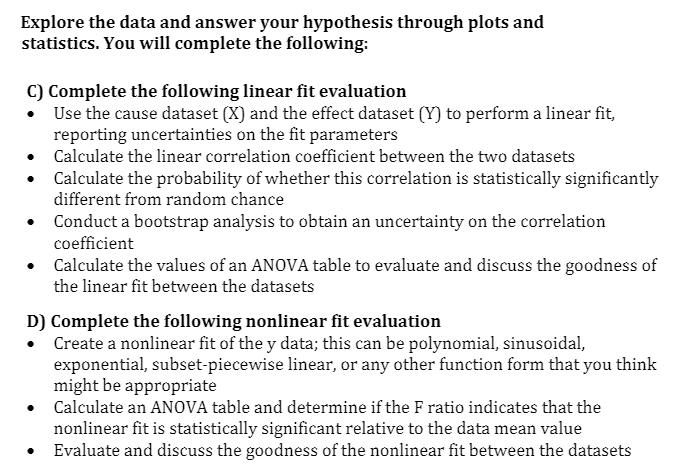
Climate Datasets: [Cause] Project; Temps. csy and [Effect] Project; Cherries. csy Hypothesis: Did minimum temperatures in Michigan during a recent period from 2010-2015 have an impact on the production of tart cherries? The connection between temperatures and cherry production is because of many different influences. Plant processes, including photosynthesis, transpiration, respiration, germination, and flowering are influenced by temperatures. As temperature increases, photosynthesis, transpiration, and respiration increase. When combined with daylength, temperature also affects the change from yegetatiye to reproductiye growth. The goal is to see if we can determine the effects of temperatures on the tart cherries. While milder temperatures can result in longer growing seasons, crops that break dormancy too early are at risk for freeze and frost damage. Tart cherries are yulnerable to these spring freeze eyents. Comparing minimum temperatures and anomalies to the production of tart cherries will be explored. Explore the data and answer your hypothesis through plots and statistics. You will complete the following: C) Complete the following linear fit evaluation . Use the cause dataset (X) and the effect dataset (Y) to perform a linear fit, reporting uncertainties on the fit parameters . Calculate the linear correlation coefficient between the two datasets . Calculate the probability of whether this correlation is statistically significantly different from random chance Conduct a bootstrap analysis to obtain an uncertainty on the correlation coefficient Calculate the values of an ANOVA table to evaluate and discuss the goodness of the linear fit between the datasets D) Complete the following nonlinear fit evaluation . Create a nonlinear fit of the y data; this can be polynomial, sinusoidal, exponential, subset-piecewise linear, or any other function form that you think might be appropriate Calculate an ANOVA table and determine if the F ratio indicates that the nonlinear fit is statistically significant relative to the data mean value . Evaluate and discuss the goodness of the nonlinear fit between the datasets
Step by Step Solution
There are 3 Steps involved in it

Get step-by-step solutions from verified subject matter experts