

Question: Clipboard E30 X E A B G H K M Autonomous consume 51 Taxes MPC 0.9 5 10 Graph of Total Expenditure Investment 6 Government
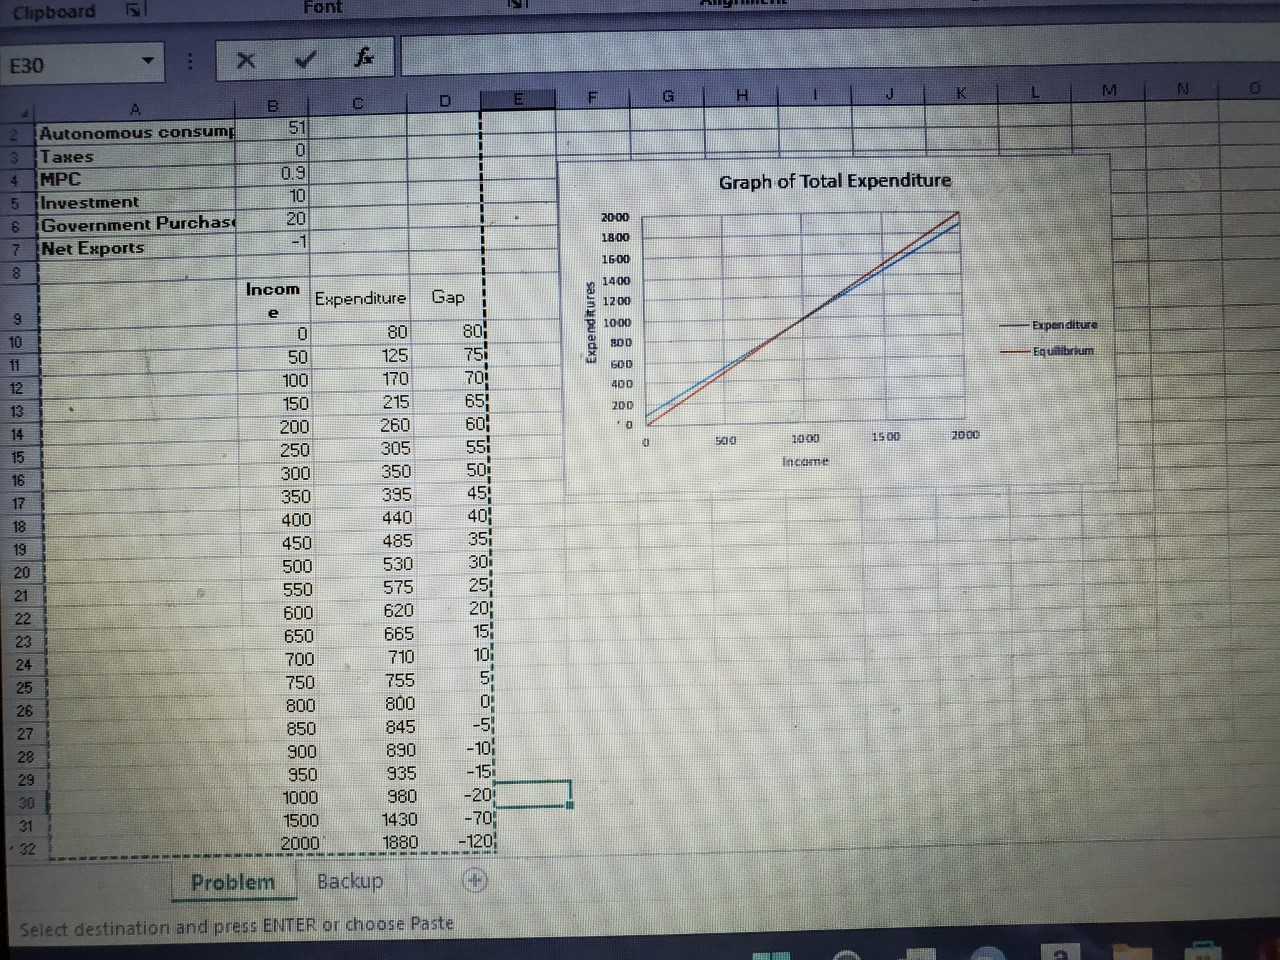
Clipboard E30 X E A B G H K M Autonomous consume 51 Taxes MPC 0.9 5 10 Graph of Total Expenditure Investment 6 Government Purchase 20 20 00 7 Net Exports -1 18 00 8 16 00 Incom 14 00 Expenditure Gap e 12 00 80 1000 Expenditi Expenditure 50 80 0 125 751 Equilibrium 12 100 170 70! 400 13 150 215 651 200 200 260 60; 250 305 551 15 00 300 350 50i Income 350 395 45! 400 440 40; 450 485 351 500 530 301 550 575 251 600 620 201 650 665 15; 700 710 101 750 755 800 800 850 845 900 890 -101 950 935 -15 1000 980 -201 1500 1430 -70 32 2000 1880 -120 Problem Backup Select destination and press ENTER or choose Paste
Step by Step Solution
There are 3 Steps involved in it
1 Expert Approved Answer
Step: 1 Unlock

Question Has Been Solved by an Expert!
Get step-by-step solutions from verified subject matter experts
Step: 2 Unlock
Step: 3 Unlock