

Question: 'Clipped' Analysis Using Annual Data 'Clipped' Analysis Using Annual Data Our first analysis rejects Harvard's conclusion that stocks outperform over the next four years when
'Clipped' Analysis Using Annual Data 'Clipped' Analysis Using Annual Data
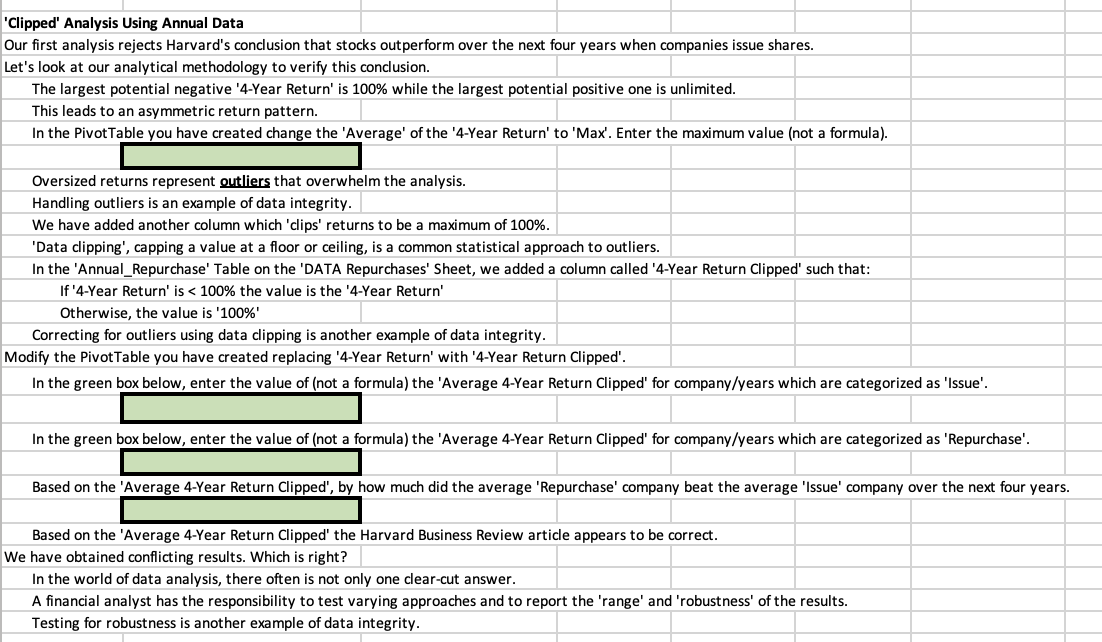
Our first analysis rejects Harvard's conclusion that stocks outperform over the next four years when companies issue shares.
Let's look at our analytical methodology to verify this conclusion.
The largest potential negative Year Return' is while the largest potential positive one is unlimited.
This leads to an asymmetric return pattern.
In the PivotTable you have created change the 'Average' of the Year Return' to 'Max'. Enter the maximum value not a formula
Oversized returns represent outliers that overwhelm the analysis.
Handling outliers is an example of data integrity.
We have added another column which 'clips' returns to be a maximum of
'Data clipping', capping a value at a floor or ceiling, is a common statistical approach to outliers.
In the 'AnnualRepurchase' Table on the 'DATA Repurchases' Sheet, we added a column called Year Return Clipped' such that:
If Year Return' is the value is the Year Return'
Otherwise, the value is
Correcting for outliers using data clipping is another example of data integrity.
Modify the PivotTable you have created replacing Year Return' with Year Return Clipped'.
In the green box below, enter the value of not a formula the 'Average Year Return Clipped' for companyyears which are categorized as 'Issue'.
In the green box below, enter the value of not a formula the 'Average Year Return Clipped' for companyyears which are categorized as 'Repurchase'.
Based on the 'Average Year Return Clipped', by how much did the average 'Repurchase' company beat the average 'Issue' company over the next four years.
Based on the 'Average Year Return Clipped' the Harvard Business Review article appears to be correct.
We have obtained conflicting results. Which is right?
In the world of data analysis, there often is not only one clearcut answer.
A financial analyst has the responsibility to test varying approaches and to report the 'range' and 'robustness' of the results.
Testing for robustness is another example of data integrity.
Step by Step Solution
There are 3 Steps involved in it
1 Expert Approved Answer
Step: 1 Unlock

Question Has Been Solved by an Expert!
Get step-by-step solutions from verified subject matter experts
Step: 2 Unlock
Step: 3 Unlock