Question: Cluster analysis model Data description Result analysis The result of the report offers a clear view of which is the group of customers that have

Cluster analysis model

Data description

Result analysis

The result of the report offers a clear view of which is the group of customers that have a high spending score.

Please include the graphs
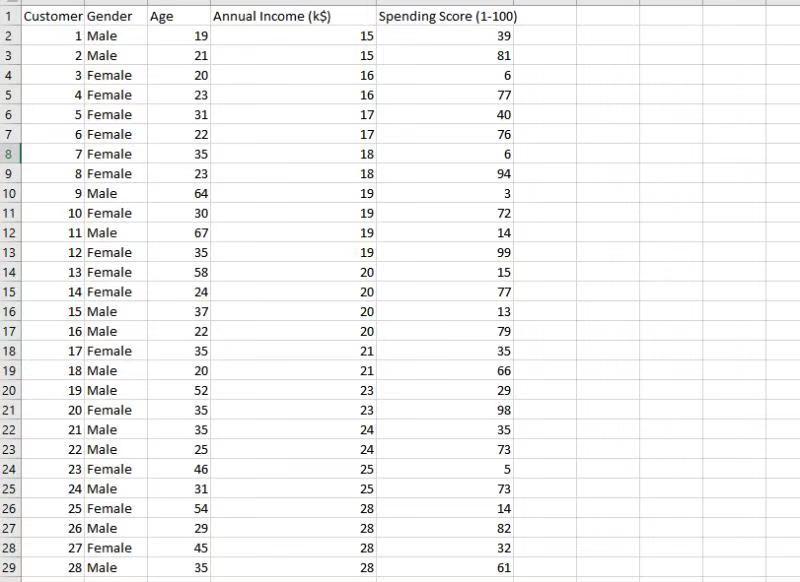
Data

Cluster analysis model Data description Result

Annual Income (k$) 19 21 20 23 6 31 Spending Score (1-100) 15 39 15 81 16 6 16 77 17 40 17 76 18 6 18 94 19 3 19 72 19 14 22 35 23 64 30 67 35 19 99 58 20 15 1 Customer Gender Age 2 1 Male 3 2 Male 4 3 Female 5 4 Female 6 5 Female 7 6 Female 8 7 Female 9 8 Female 10 9 Male 11 10 Female 12 11 Male 13 12 Female 14 13 Female 15 14 Female 16 15 Male 17 16 Male 18 17 Female 19 18 Male 20 19 Male 21 20 Female 22 21 Male 23 22 Male 24 23 Female 25 24 Male 26 25 Female 27 26 Male 28 27 Female 29 28 Male 24 20 77 37 20 13 22 20 79 35 21 35 20 21 66 52 23 23 35 35 25 29 98 35 24 24 73 46 25 5 73 31 25 14 54 29 45 82 28 28 28 28 32 35 61

Step by Step Solution

There are 3 Steps involved in it

1 Expert Approved Answer
Step: 1 Unlock blur-text-image
Question Has Been Solved by an Expert!

Get step-by-step solutions from verified subject matter experts

Step: 2 Unlock
Step: 3 Unlock

Students Have Also Explored These Related General Management Questions!