

Question: CLV calculation example Using the Tier One customer data in the scenario, the CLV for a Tier One customer is calculated as follows: Where
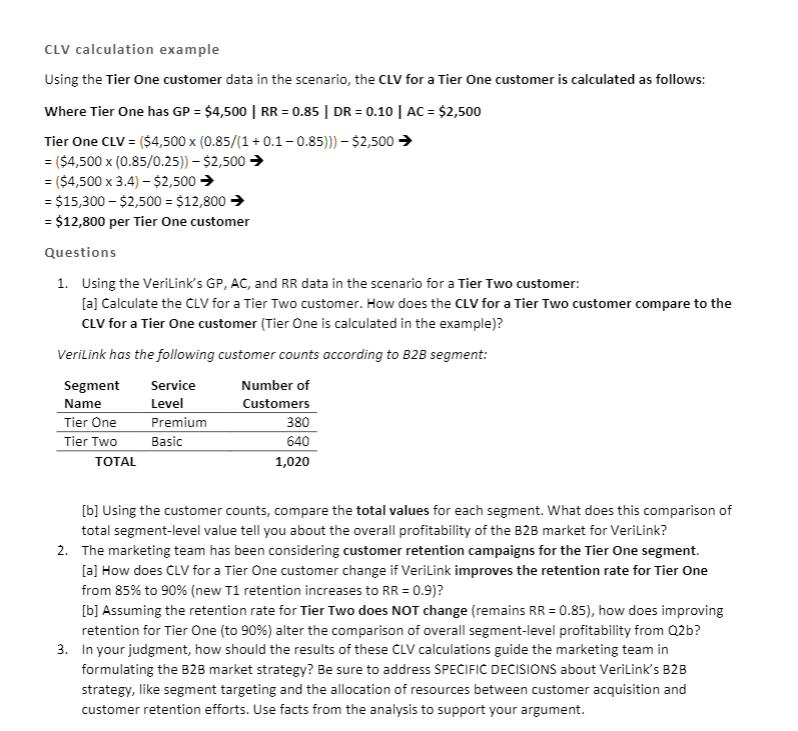
CLV calculation example Using the Tier One customer data in the scenario, the CLV for a Tier One customer is calculated as follows: Where Tier One has GP = $4,500 | RR = 0.85 | DR = 0.10| AC = $2,500 Tier One CLV = ($4,500 x (0.85/(1+ 0.1-0.85))) - $2,500 = ($4,500 x (0.85/0.25)) $2,500 = ($4,500 x 3.4) $2,500 = $15,300 $2,500 = $12,800 = $12,800 per Tier One customer Questions 1. Using the VerilLink's GP, AC, and RR data in the scenario for a Tier Two customer: [a] Calculate the CLV for a Tier Two customer. How does the CLV for a Tier Two customer compare to the CLV for a Tier One customer (Tier One is calculated in the example)? Verilink has the following customer counts according to B2B segment: Segment Service Number of Level Name Tier One Tier Two Customers Premium 380 Basic 640 OTAL 1,020 [b] Using the customer counts, compare the total values for each segment. What does this comparison of total segment-level value tell you about the overall profitability of the B2B market for Verilink? 2. The marketing team has been considering customer retention campaigns for the Tier One segment. [a] How does CLV for a Tier One customer change if Verilink improves the retention rate for Tier One from 85% to 90% (new T1 retention increases to RR = 0.9)? [b] Assuming the retention rate for Tier Two does NOT change (remains RR = 0.85), how does improving retention for Tier One (to 90%) alter the comparison of overall segment-level profitability from Q2b? 3. In your judgment, how should the results of these CLV calculations guide the marketing team in formulating the B2B market strategy? Be sure to address SPECIFIC DECISIONS about Verilink's B2B strategy, like segment targeting and the allocation of resources between customer acquisition and customer retention efforts. Use facts from the analysis to support your argument.
Step by Step Solution
3.40 Rating (150 Votes )
There are 3 Steps involved in it
Ans 1a Let us assume Average Gross Margin per customer life span for Tier Two customer is A g Rate o... View full answer

Get step-by-step solutions from verified subject matter experts