

Question: CODE IN PYTHON PLEASE We are going to look at atmospheric absorption, transmission and common photometric bands. Get NIR and MIR atmospheric transmission plots from
 CODE IN PYTHON PLEASE
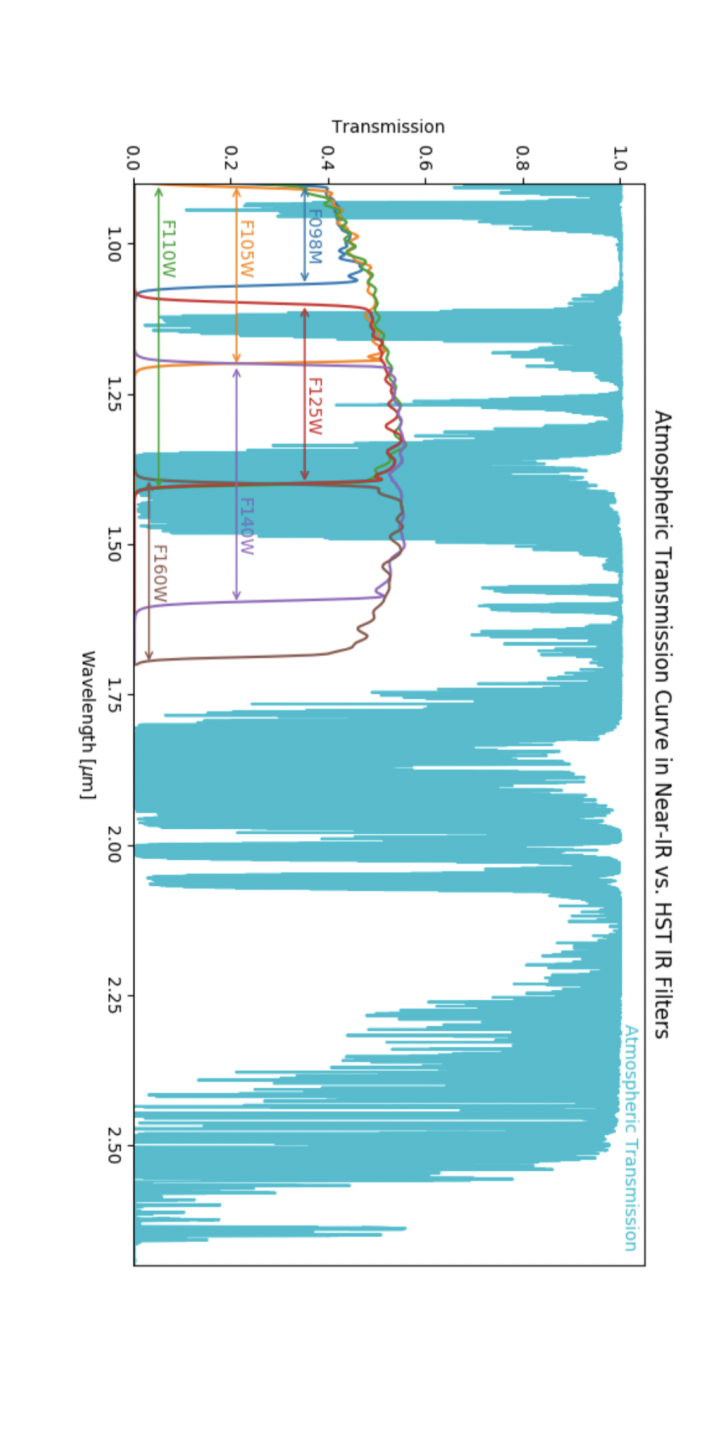
We are going to look at atmospheric absorption, transmission and common photometric bands. Get NIR and MIR atmospheric transmission plots from here: http://www.gemini.edu/sciops/telescopes-and-sites/observing-condition-constraints/irtransmission-spectra Download the data for the atmospheric transmission at Mauna Kea (you can use the first ascii file listed in the first table below the plots with water vapor column of 1.0mm and air mass of 1.0). Note this file has two columns: the first column is wavelength in microns, and the second column is the transmission curve. Get the filter transmission curves here: http://quasar.astro.illinois.edu/teaching/ASTR414/filters/ (download the .zip file for everything) Find the bands in the IR regime (hint: those are with filename f*.IR.tab.txt). Plot the atmospheric transmission and filter curves in the same plot - Restrict the wavelength plotted to be the near-IR regime (0.9-2.7 micron) - Label the axes properly - Label the filter names (i.e., f105w, f110w, etc) - Use different colors for different filters (curve and label). hint: - google "atmospheric opacity" for some examples - If you don't know how to read ascii data into python, check http://docs.astropy.org/en/stable/io/ ascii/ Atmospheric Transmission Curve in Near-IR vs. HST IR Filters
Step by Step Solution
There are 3 Steps involved in it

Get step-by-step solutions from verified subject matter experts