

Question: code in R code in R 1. Let Xi ~ Gamma(4,8) and X, ~ Gamma(7,20). Thus, E[X2] = 32 and Var[X2] = 140. Let Y
![X, ~ Gamma(7,20). Thus, E[X2] = 32 and Var[X2] = 140. Let](https://dsd5zvtm8ll6.cloudfront.net/si.experts.images/questions/2024/09/66f3305ddac74_66166f3305d77827.jpg)
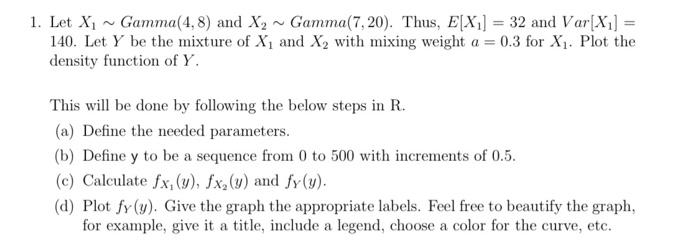
1. Let Xi ~ Gamma(4,8) and X, ~ Gamma(7,20). Thus, E[X2] = 32 and Var[X2] = 140. Let Y be the mixture of X, and X, with mixing weight a = 0.3 for X. Plot the density function of Y. This will be done by following the below steps in R. (a) Define the needed parameters. (b) Define y to be a sequence from 0 to 500 with increments of 0.5. (c) Calculate fxz(y), fx,() and fy(y). (d) Plot fy(y). Give the graph the appropriate labels. Feel free to beautify the graph, for example, give it a title, include a legend, choose a color for the curve, etc. 1. Let Xi ~ Gamma(4,8) and X, ~ Gamma(7,20). Thus, E[X2] = 32 and Var[X2] = 140. Let Y be the mixture of X, and X, with mixing weight a = 0.3 for X. Plot the density function of Y. This will be done by following the below steps in R. (a) Define the needed parameters. (b) Define y to be a sequence from 0 to 500 with increments of 0.5. (c) Calculate fxz(y), fx,() and fy(y). (d) Plot fy(y). Give the graph the appropriate labels. Feel free to beautify the graph, for example, give it a title, include a legend, choose a color for the curve, etc. 1. Let Xi ~ Gamma(4,8) and X, ~ Gamma(7,20). Thus, E[X2] = 32 and Var[X2] = 140. Let Y be the mixture of X, and X, with mixing weight a = 0.3 for X. Plot the density function of Y. This will be done by following the below steps in R. (a) Define the needed parameters. (b) Define y to be a sequence from 0 to 500 with increments of 0.5. (c) Calculate fxz(y), fx,() and fy(y). (d) Plot fy(y). Give the graph the appropriate labels. Feel free to beautify the graph, for example, give it a title, include a legend, choose a color for the curve, etc. 1. Let Xi ~ Gamma(4,8) and X, ~ Gamma(7,20). Thus, E[X2] = 32 and Var[X2] = 140. Let Y be the mixture of X, and X, with mixing weight a = 0.3 for X. Plot the density function of Y. This will be done by following the below steps in R. (a) Define the needed parameters. (b) Define y to be a sequence from 0 to 500 with increments of 0.5. (c) Calculate fxz(y), fx,() and fy(y). (d) Plot fy(y). Give the graph the appropriate labels. Feel free to beautify the graph, for example, give it a title, include a legend, choose a color for the curve, etc
Step by Step Solution
There are 3 Steps involved in it

Get step-by-step solutions from verified subject matter experts