

Question: Code is provided for #1. I need #2,#3,and #4 t=-4:0.01:4 ; x1 = 1.274 .* sin(2.*pi.*t); x2 = 0.425 .* sin(6.*pi.*t) ; x3 = 0.255
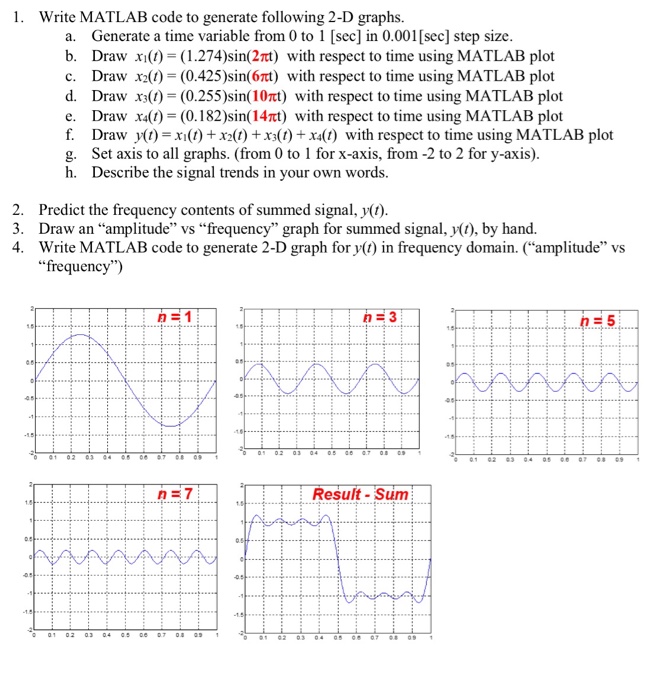
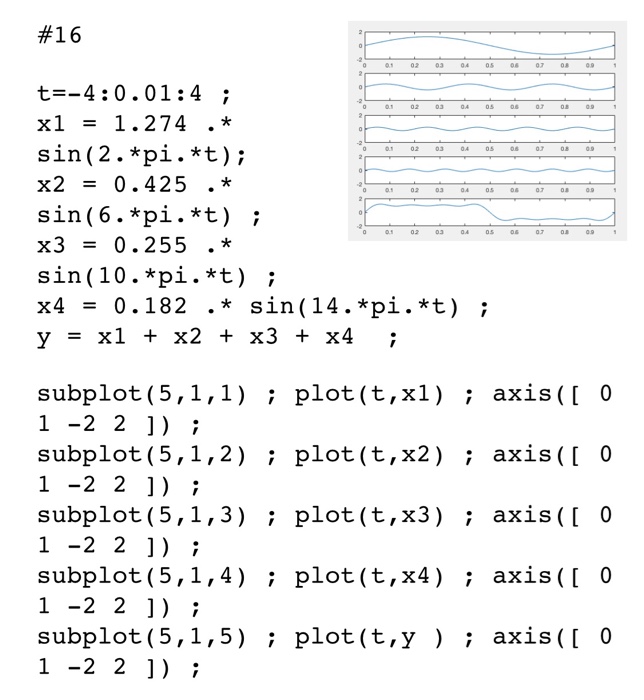
1. Write MATLAB code to generate following 2-D graphs. a. Generate a time variable from 0 to 1 [sec] in 0.001 [sec] step size b. Draw xi()- (1.274)sin(2Tt) with respect to time using MATLAB plot c. Draw x2() (0.425)sin(6Tt) with respect to time using MATLAB plot d. Draw x3(t)- (0.255)sin(10t) with respect to time using MATLAB plot e. Draw x4() (0.182)sin(14t) with respect to time using MATLAB plot f. Draw y(t)-xi(t) +x2(t) +x(t) xt) with respect to time using MATLAB plot g. Set axis to all graphs. (from 0 to 1 for x-axis, from -2 to 2 for y-axis) h. Describe the signal trends in your own words. 2. 3. 4. Predict the frequency contents of summed signal, y(t) Draw an "amplitude" vs "frequency" graph for summed signal, y(t), by hand. Write MATLAB code to generate 2-D graph for y(1) 1n frequency domain. ("amplitude" vs "frequency") h 3 Result-Sum
Step by Step Solution
There are 3 Steps involved in it

Get step-by-step solutions from verified subject matter experts