

Question: Code Listing 1: Sample Data for the Bar Chart private static double] avgHousingPricesByYear 247381.0,264171.4,287715.3,294736.1, 308431.4,322635.9, 340253.0,363153.7 li private static double] avgCommercialPricesByYear-I 1121585.3,1219479.5,1246354.2,1295364.8 1335932.6,1472362.0,1583521.9,1613246.3 Create a
![double] avgHousingPricesByYear 247381.0,264171.4,287715.3,294736.1, 308431.4,322635.9, 340253.0,363153.7 li private static double] avgCommercialPricesByYear-I 1121585.3,1219479.5,1246354.2,1295364.8 1335932.6,1472362.0,1583521.9,1613246.3](https://dsd5zvtm8ll6.cloudfront.net/si.experts.images/questions/2024/09/66f086bd088cb_16466f086bc7b127.jpg)
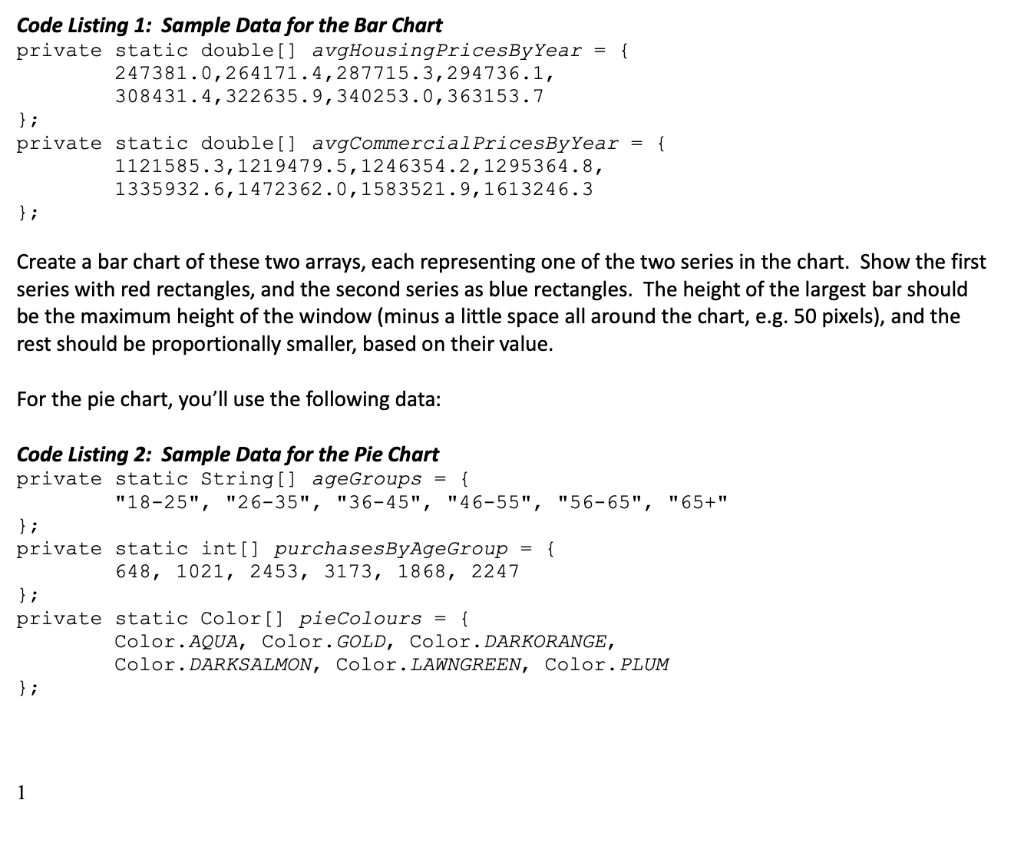
Code Listing 1: Sample Data for the Bar Chart private static double] avgHousingPricesByYear 247381.0,264171.4,287715.3,294736.1, 308431.4,322635.9, 340253.0,363153.7 li private static double] avgCommercialPricesByYear-I 1121585.3,1219479.5,1246354.2,1295364.8 1335932.6,1472362.0,1583521.9,1613246.3 Create a bar chart of these two arrays, each representing one of the two series in the chart. Show the first series with red rectangles, and the second series as blue rectangles. The height of the largest bar should be the maximum height of the window (minus a little space all around the chart, e.g. 50 pixels), and the rest should be proportionally smaller, based on their value. For the pie chart, you'll use the following data: Code Listing 2: Sample Data for the Pie Chart private static Stringl] ageGroups( "18-25", "26-35", "36-45", "46-55", "56-65", "65+" private static int[ purchasesByAgeGroup 648, 1021, 2453, 3173, 1868, 2247 li private static Color pieColours Color.AQUA, Color.GOLD, Color. DARKORANGE Color.DARKSALMON, Color. LAWNGREEN, Color. PLUM Create a pie chart of the purchasesByAgeGroup array, by drawing a series of arcs. The colour of each arc should correspond to the colour at the same index in the pieColors array. Note: See figure 1 for an example of the final product. Figure 1: The running application, showing the two charts Lab 06 Code Listing 1: Sample Data for the Bar Chart private static double] avgHousingPricesByYear 247381.0,264171.4,287715.3,294736.1, 308431.4,322635.9, 340253.0,363153.7 li private static double] avgCommercialPricesByYear-I 1121585.3,1219479.5,1246354.2,1295364.8 1335932.6,1472362.0,1583521.9,1613246.3 Create a bar chart of these two arrays, each representing one of the two series in the chart. Show the first series with red rectangles, and the second series as blue rectangles. The height of the largest bar should be the maximum height of the window (minus a little space all around the chart, e.g. 50 pixels), and the rest should be proportionally smaller, based on their value. For the pie chart, you'll use the following data: Code Listing 2: Sample Data for the Pie Chart private static Stringl] ageGroups( "18-25", "26-35", "36-45", "46-55", "56-65", "65+" private static int[ purchasesByAgeGroup 648, 1021, 2453, 3173, 1868, 2247 li private static Color pieColours Color.AQUA, Color.GOLD, Color. DARKORANGE Color.DARKSALMON, Color. LAWNGREEN, Color. PLUM Create a pie chart of the purchasesByAgeGroup array, by drawing a series of arcs. The colour of each arc should correspond to the colour at the same index in the pieColors array. Note: See figure 1 for an example of the final product. Figure 1: The running application, showing the two charts Lab 06
Step by Step Solution
There are 3 Steps involved in it

Get step-by-step solutions from verified subject matter experts