Question: Code so far: import random import time #from memory_profiler import profile profile.run def multiply(): for i in range(size): for j in range(size): for k in

Code so far:
import random import time #from memory_profiler import profile profile.run def multiply(): for i in range(size): for j in range(size): for k in range(size): P[i][j]=P[i][j]+(A[i][k]*B[k][j])
size=int(input("Enter size: "))
r1=size c1=size r2=size c2=size
A=[[ 0 for i in range(c1)] for j in range(r1)]
for i in range(r1): for j in range(c1): x=random.randint(1,100) A[i][j]=x B=[[0 for i in range(c2)] for j in range(r2)]
for i in range(r2): for j in range(c2): x=random.randint(1,100) B[i][j]=x P=[[0 for i in range(c2)] for j in range(r1)]
st=time.time() multiply() end=time.time() elapsed_time=(end-st) print("Overall time: ",elapsed_time) print("Number of elements in the rersult Matrix: ",size*size)
***Need help with part 2!
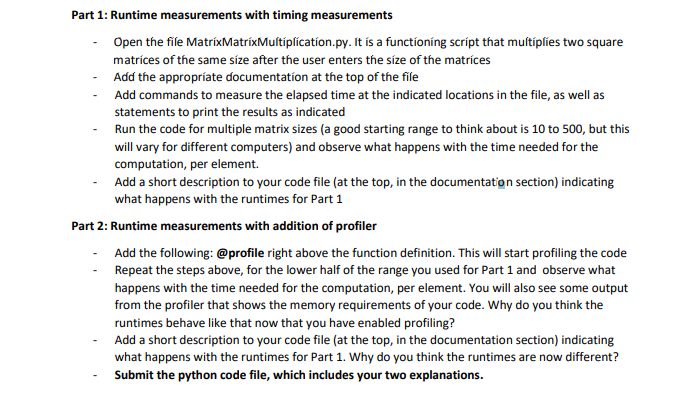
Part 1: Runtime measurements with timing measurements Open the file MatrixMatrixMultiplication.py. It is a functioning script that multiplies two square matrices of the same size after the user enters the size of the matrices Add the appropriate documentation at the top of the file Add commands to measure the elapsed time at the indicated locations in the file, as well as statements to print the results as indicated Run the code for multiple matrix sizes (a good starting range to think about is 10 to 500, but this will vary for different computers) and observe what happens with the time needed for the computation, per element. Add a short description to your code file (at the top, in the documentation section) indicating what happens with the runtimes for Part 1 Part 2: Runtime measurements with addition of profiler Add the following: @profile right above the function definition. This will start profiling the code Repeat the steps above, for the lower half of the range you used for Part 1 and observe what happens with the time needed for the computation, per element. You will also see some output from the profiler that shows the memory requirements of your code. Why do you think the runtimes behave like that now that you have enabled profiling? Add a short description to your code file (at the top, in the documentation section) indicating what happens with the runtimes for Part 1. Why do you think the runtimes are now different? Submit the python code file, which includes your two explanations. Part 1: Runtime measurements with timing measurements Open the file MatrixMatrixMultiplication.py. It is a functioning script that multiplies two square matrices of the same size after the user enters the size of the matrices Add the appropriate documentation at the top of the file Add commands to measure the elapsed time at the indicated locations in the file, as well as statements to print the results as indicated Run the code for multiple matrix sizes (a good starting range to think about is 10 to 500, but this will vary for different computers) and observe what happens with the time needed for the computation, per element. Add a short description to your code file (at the top, in the documentation section) indicating what happens with the runtimes for Part 1 Part 2: Runtime measurements with addition of profiler Add the following: @profile right above the function definition. This will start profiling the code Repeat the steps above, for the lower half of the range you used for Part 1 and observe what happens with the time needed for the computation, per element. You will also see some output from the profiler that shows the memory requirements of your code. Why do you think the runtimes behave like that now that you have enabled profiling? Add a short description to your code file (at the top, in the documentation section) indicating what happens with the runtimes for Part 1. Why do you think the runtimes are now different? Submit the python code file, which includes your two explanations
Step by Step Solution
There are 3 Steps involved in it

Get step-by-step solutions from verified subject matter experts


