

Question: ####################################################### # # Code to help with part 1: # - combine factor levels; # - cut numerical variables into groups # ####################################################### # Create
####################################################### # # Code to help with part 1: # - combine factor levels; # - cut numerical variables into groups # #######################################################
# Create some fake data and pretend it is our project data set:
response
# Put them in a data set:
some.data
rm(response, factor1, factor2, another.variable)
############################################ # # Now suppose we wanted to create a new # factor variable that took the values # "high" if factor1 = A or B, "medium" # if factor1 = C, D, or E, and "low" # otherwise. # ############################################ attach(some.data)
new.factor1
levels(new.factor1)
# Put the new factor into the data frame:
detach() some.data$new.factor1
rm(new.factor1)
############################################################## # # And to recode factor2 so that A & B = "Morning" # and C = "Afternoon" # ##############################################################
attach(some.data)
new.factor2
levels(new.factor2)
detach() some.data$new.factor2
rm(new.factor2)
############################################################## # # Finally, what if we wanted to turn a numerical variable # (like "another.variable") into a factor variable with levels # dependent on the values the variable takes? # E.G.: if
attach(some.data)
range(another.variable)
new.variable
# Rename the levels so they are a bit nicer:
levels(new.variable)
# Put this one into the data frame too: detach() some.data$new.variable
rm(new.variable)
((((( i put an example you can take variables from them )))))
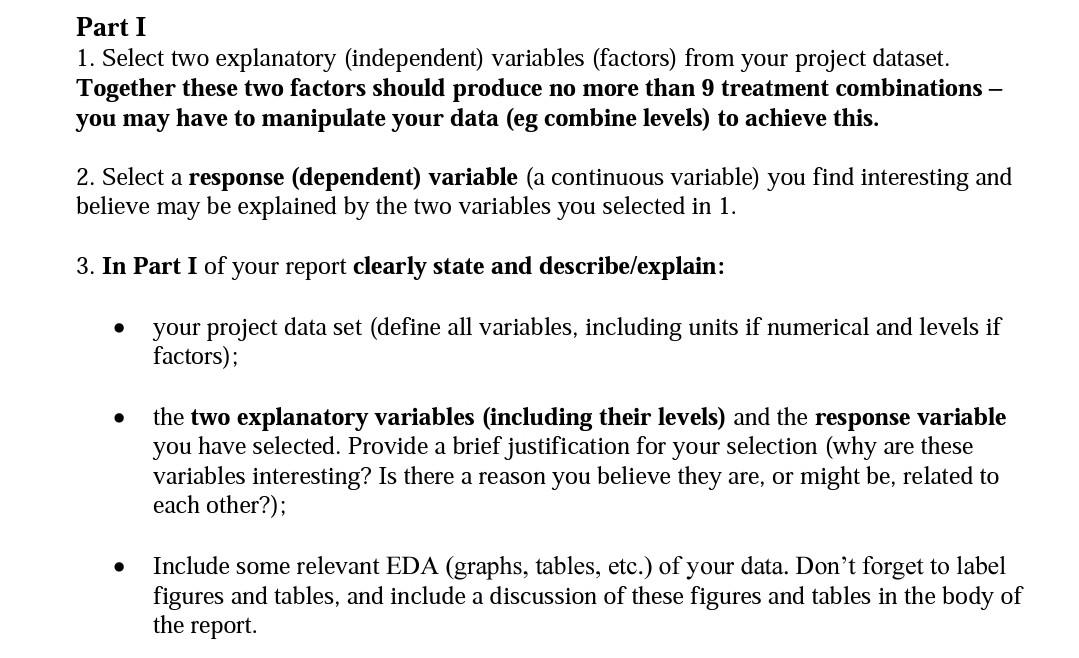
Part I 1. Select two explanatory (independent) variables (factors) from your project dataset. Together these two factors should produce no more than 9 treatment combinations - you may have to manipulate your data (eg combine levels) to achieve this. 2. Select a response (dependent) variable (a continuous variable) you find interesting and believe may be explained by the two variables you selected in 1. 3. In Part I of your report clearly state and describe/explain: your project data set (define all variables, including units if numerical and levels if factors); the two explanatory variables (including their levels) and the response variable you have selected. Provide a brief justification for your selection (why are these variables interesting? Is there a reason you believe they are, or might be, related to each other?); . Include some relevant EDA (graphs, tables, etc.) of your data. Don't forget to label figures and tables, and include a discussion of these figures and tables in the body of the report
Step by Step Solution
There are 3 Steps involved in it

Get step-by-step solutions from verified subject matter experts