

Question: code using matlab 2. Create plots of the following functions from x=0 to 10. Use a suitable spacing to make the curves look smooth. (
code using matlab 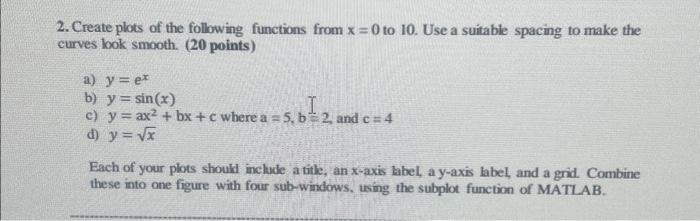
2. Create plots of the following functions from x=0 to 10. Use a suitable spacing to make the curves look smooth. ( 20 points) a) y=ex b) y=sin(x) c) y=ax2+bx+c where a=5,b=2 and c=4 d) y=x Each of your plots should include a title, an x-axis label, a y-axis label, and a grid. Combine these into one figure with four sub-windows, using the subplot function of MATLAB
Step by Step Solution
There are 3 Steps involved in it
1 Expert Approved Answer
Step: 1 Unlock

Question Has Been Solved by an Expert!
Get step-by-step solutions from verified subject matter experts
Step: 2 Unlock
Step: 3 Unlock