

Question: coding in R 11. The following exercise uses the dataset College.csv uploaded on Moodle (folder: 'Data for R) a import the file correctly in R.
coding in R
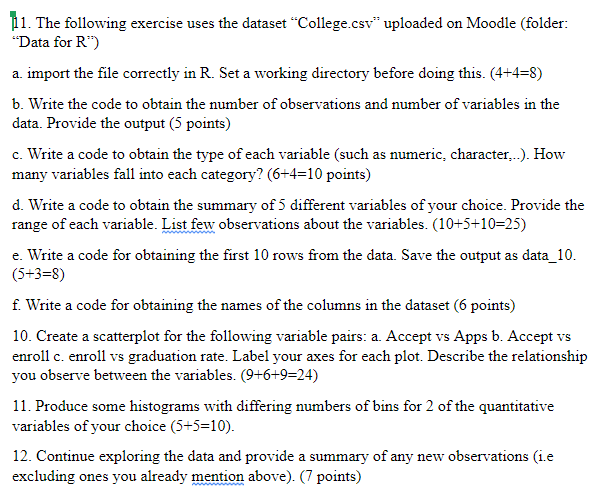
11. The following exercise uses the dataset College.csv" uploaded on Moodle (folder: "'Data for R") a import the file correctly in R. Set a working directory before doing this. (4+4=8) b. Write the code to obtain the number of observations and number of variables in the data. Provide the output (5 points) c. Write a code to obtain the type of each variable (such as numeric character...). How many variables fall into each category? (6+4=10 points) d. Write a code to obtain the summary of 5 different variables of your choice. Provide the range of each variable. List few observations about the variables. (10+5+10=25) e. Write a code for obtaining the first 10 rows from the data. Save the output as data_10. (5+3=8) f. Write a code for obtaining the names of the columns in the dataset (6 points) 10. Create a scatterplot for the following variable pairs: a. Accept vs Apps b. Accept vs enroll c. enroll vs graduation rate. Label your axes for each plot. Describe the relationship you observe between the variables. (9+6+9=24) 11. Produce some histograms with differing numbers of bins for 2 of the quantitative variables of your choice (5+5=10). 12. Continue exploring the data and provide a summary of any new observations (1.e excluding ones you already mention above) (7 points) 11. The following exercise uses the dataset College.csv" uploaded on Moodle (folder: "'Data for R") a import the file correctly in R. Set a working directory before doing this. (4+4=8) b. Write the code to obtain the number of observations and number of variables in the data. Provide the output (5 points) c. Write a code to obtain the type of each variable (such as numeric character...). How many variables fall into each category? (6+4=10 points) d. Write a code to obtain the summary of 5 different variables of your choice. Provide the range of each variable. List few observations about the variables. (10+5+10=25) e. Write a code for obtaining the first 10 rows from the data. Save the output as data_10. (5+3=8) f. Write a code for obtaining the names of the columns in the dataset (6 points) 10. Create a scatterplot for the following variable pairs: a. Accept vs Apps b. Accept vs enroll c. enroll vs graduation rate. Label your axes for each plot. Describe the relationship you observe between the variables. (9+6+9=24) 11. Produce some histograms with differing numbers of bins for 2 of the quantitative variables of your choice (5+5=10). 12. Continue exploring the data and provide a summary of any new observations (1.e excluding ones you already mention above) (7 points)
Step by Step Solution
There are 3 Steps involved in it

Get step-by-step solutions from verified subject matter experts