

Question: CODING WITH R Use the following data set on the Tower of Pisa, study linear model with R. a. input the year data into a
CODING WITH R
Use the following data set on the Tower of Pisa, study linear model with R.
a. input the year data into a variable years; use the R function;
c(1975,1976,1977,1978,1979,1980,1981,1982,1983,1984,1985,1986,1987)
b. input the lean data into a variable leans; use the R function scan() or c();
c(2.9642,2.9644,2.9656,2.9667,2.9673,2.9688,2.9696,2.9698,2.9713,2.9717,2.9725,2.9742,2.9757)
c. make the scatter plot of years and leans; use the R function plot();
d. guess a linear model that can fit this data, i.e., guess the slope and intercept, and then plot the results with the R function abline(). You can use your function as
abline(guessed_intercept, guessed_slope)
or use help(abline) to find more info about the use of the model
e. figure out R commands to compute the mean squared error of the predictions
(In this formula, b = the y intercept, and m = slope):
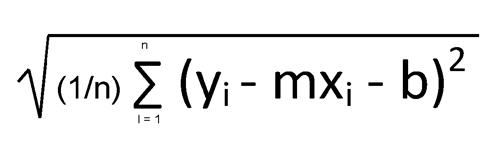
f. compute the mean squared error of the prediction of your linear model with your neighbors, see who can come up with the closest fit.
(1) (yi-mx-b)2
Step by Step Solution
There are 3 Steps involved in it

Get step-by-step solutions from verified subject matter experts