

Question: Coefficients Standardized Unstandardized Coefficients Coefficients 95.0% Confidence Interval for B Collinearity Statistics Model B Std. Error Beta t Sig. Lower Bound Upper Bound Tolerance
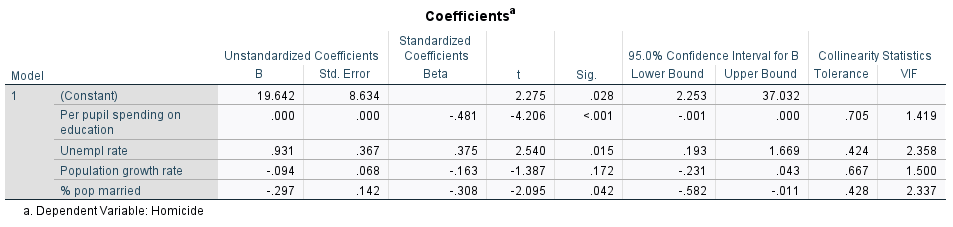
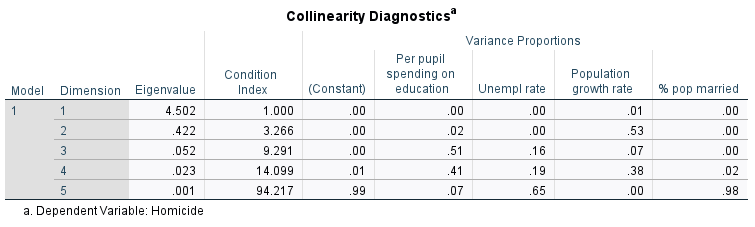
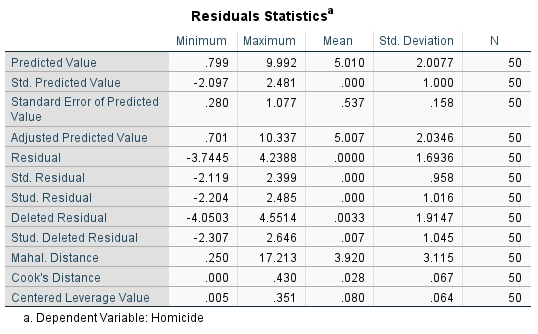
Coefficients Standardized Unstandardized Coefficients Coefficients 95.0% Confidence Interval for B Collinearity Statistics Model B Std. Error Beta t Sig. Lower Bound Upper Bound Tolerance VIF 1 (Constant) 19.642 8.634 2.275 .028 2.253 37.032 Per pupil spending on .000 .000 -.481 -4.206 Model 1 Dimension Eigenvalue 1 2 3 4 5 Collinearity Diagnostics Variance Proportions Condition Per pupil spending on Population Index (Constant) education Unempl rate growth rate % pop married 4.502 1.000 .00 .00 .00 .01 .00 .422 3.266 .00 .02 .00 .53 .00 .052 9.291 .00 .51 .16 .07 .00 .023 14.099 .01 .41 .19 .38 .02 .001 94.217 .99 .07 10 .65 .00 .98 a. Dependent Variable: Homicide. Residuals Statistics Minimum Maximum Mean Std. Deviation N Predicted Value .799 9.992 5.010 2.0077 50 Std. Predicted Value -2.097 2.481 .000 1.000 50 Standard Error of Predicted .280 1.077 .537 .158 50 Value Adjusted Predicted Value .701 10.337 5.007 2.0346 50 Residual -3.7445 4.2388 .0000 1.6936 50 Std. Residual -2.119 2.399 .000 .958 50 Stud. Residual -2.204 2.485 .000 1.016 50 Deleted Residual -4.0503 4.5514 .0033 1.9147 50 Stud. Deleted Residual -2.307 2.646 .007 1.045 50 Mahal. Distance .250 17.213 3.920 3.115 50 Cook's Distance .000 .430 .028 .067 50 Centered Leverage Value .005 .351 .080 .064 50 a. Dependent Variable: Homicide
Step by Step Solution
There are 3 Steps involved in it

Get step-by-step solutions from verified subject matter experts