

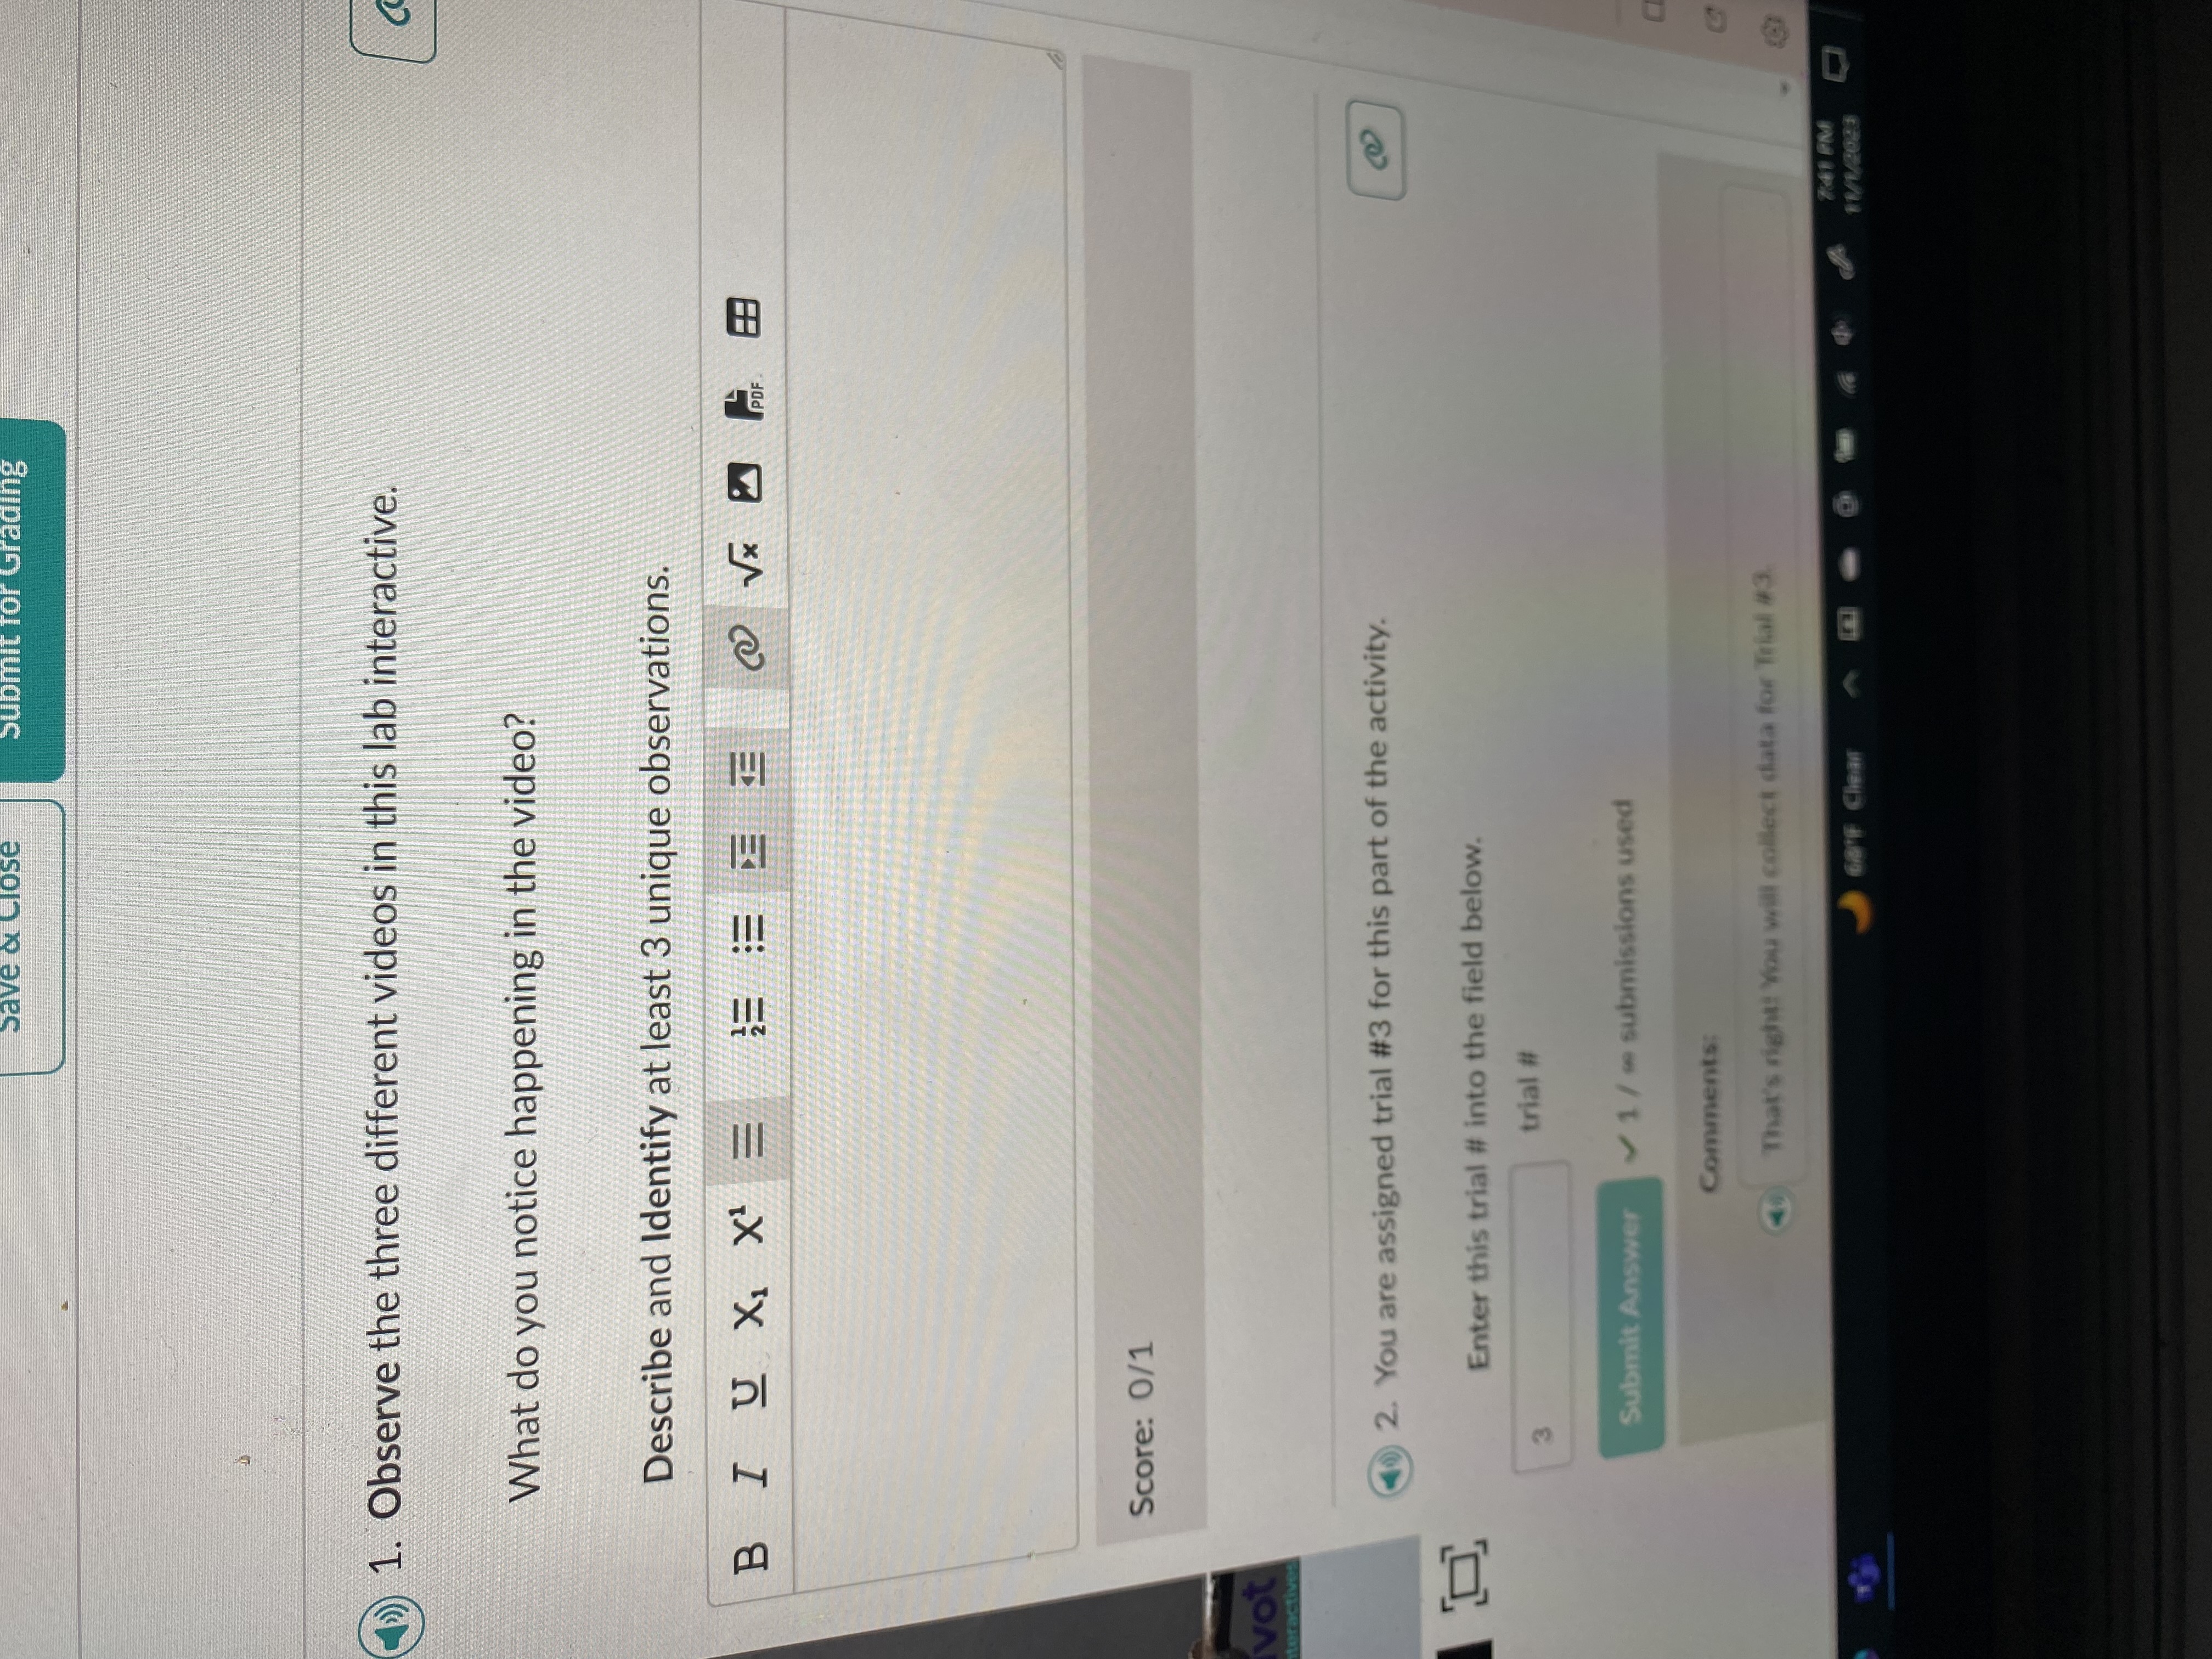
Question: Collecting data and constructing a graph The pictures 1 to 3 show the temp of a heated beaker. Analyze a complete data set from the


Collecting data and constructing a graph
The pictures 1 to 3 show the temp of a heated beaker.
Analyze a complete data set from the 3 pictures showing boiling water.
Answer each question with the pictures provide. Question 1 you would use the first 3 picture to answer the question.Starting at Question 3 you would use trail #3 which is the 3rd picture. To answer question 3 down to 15.
Reference: pivot interactives

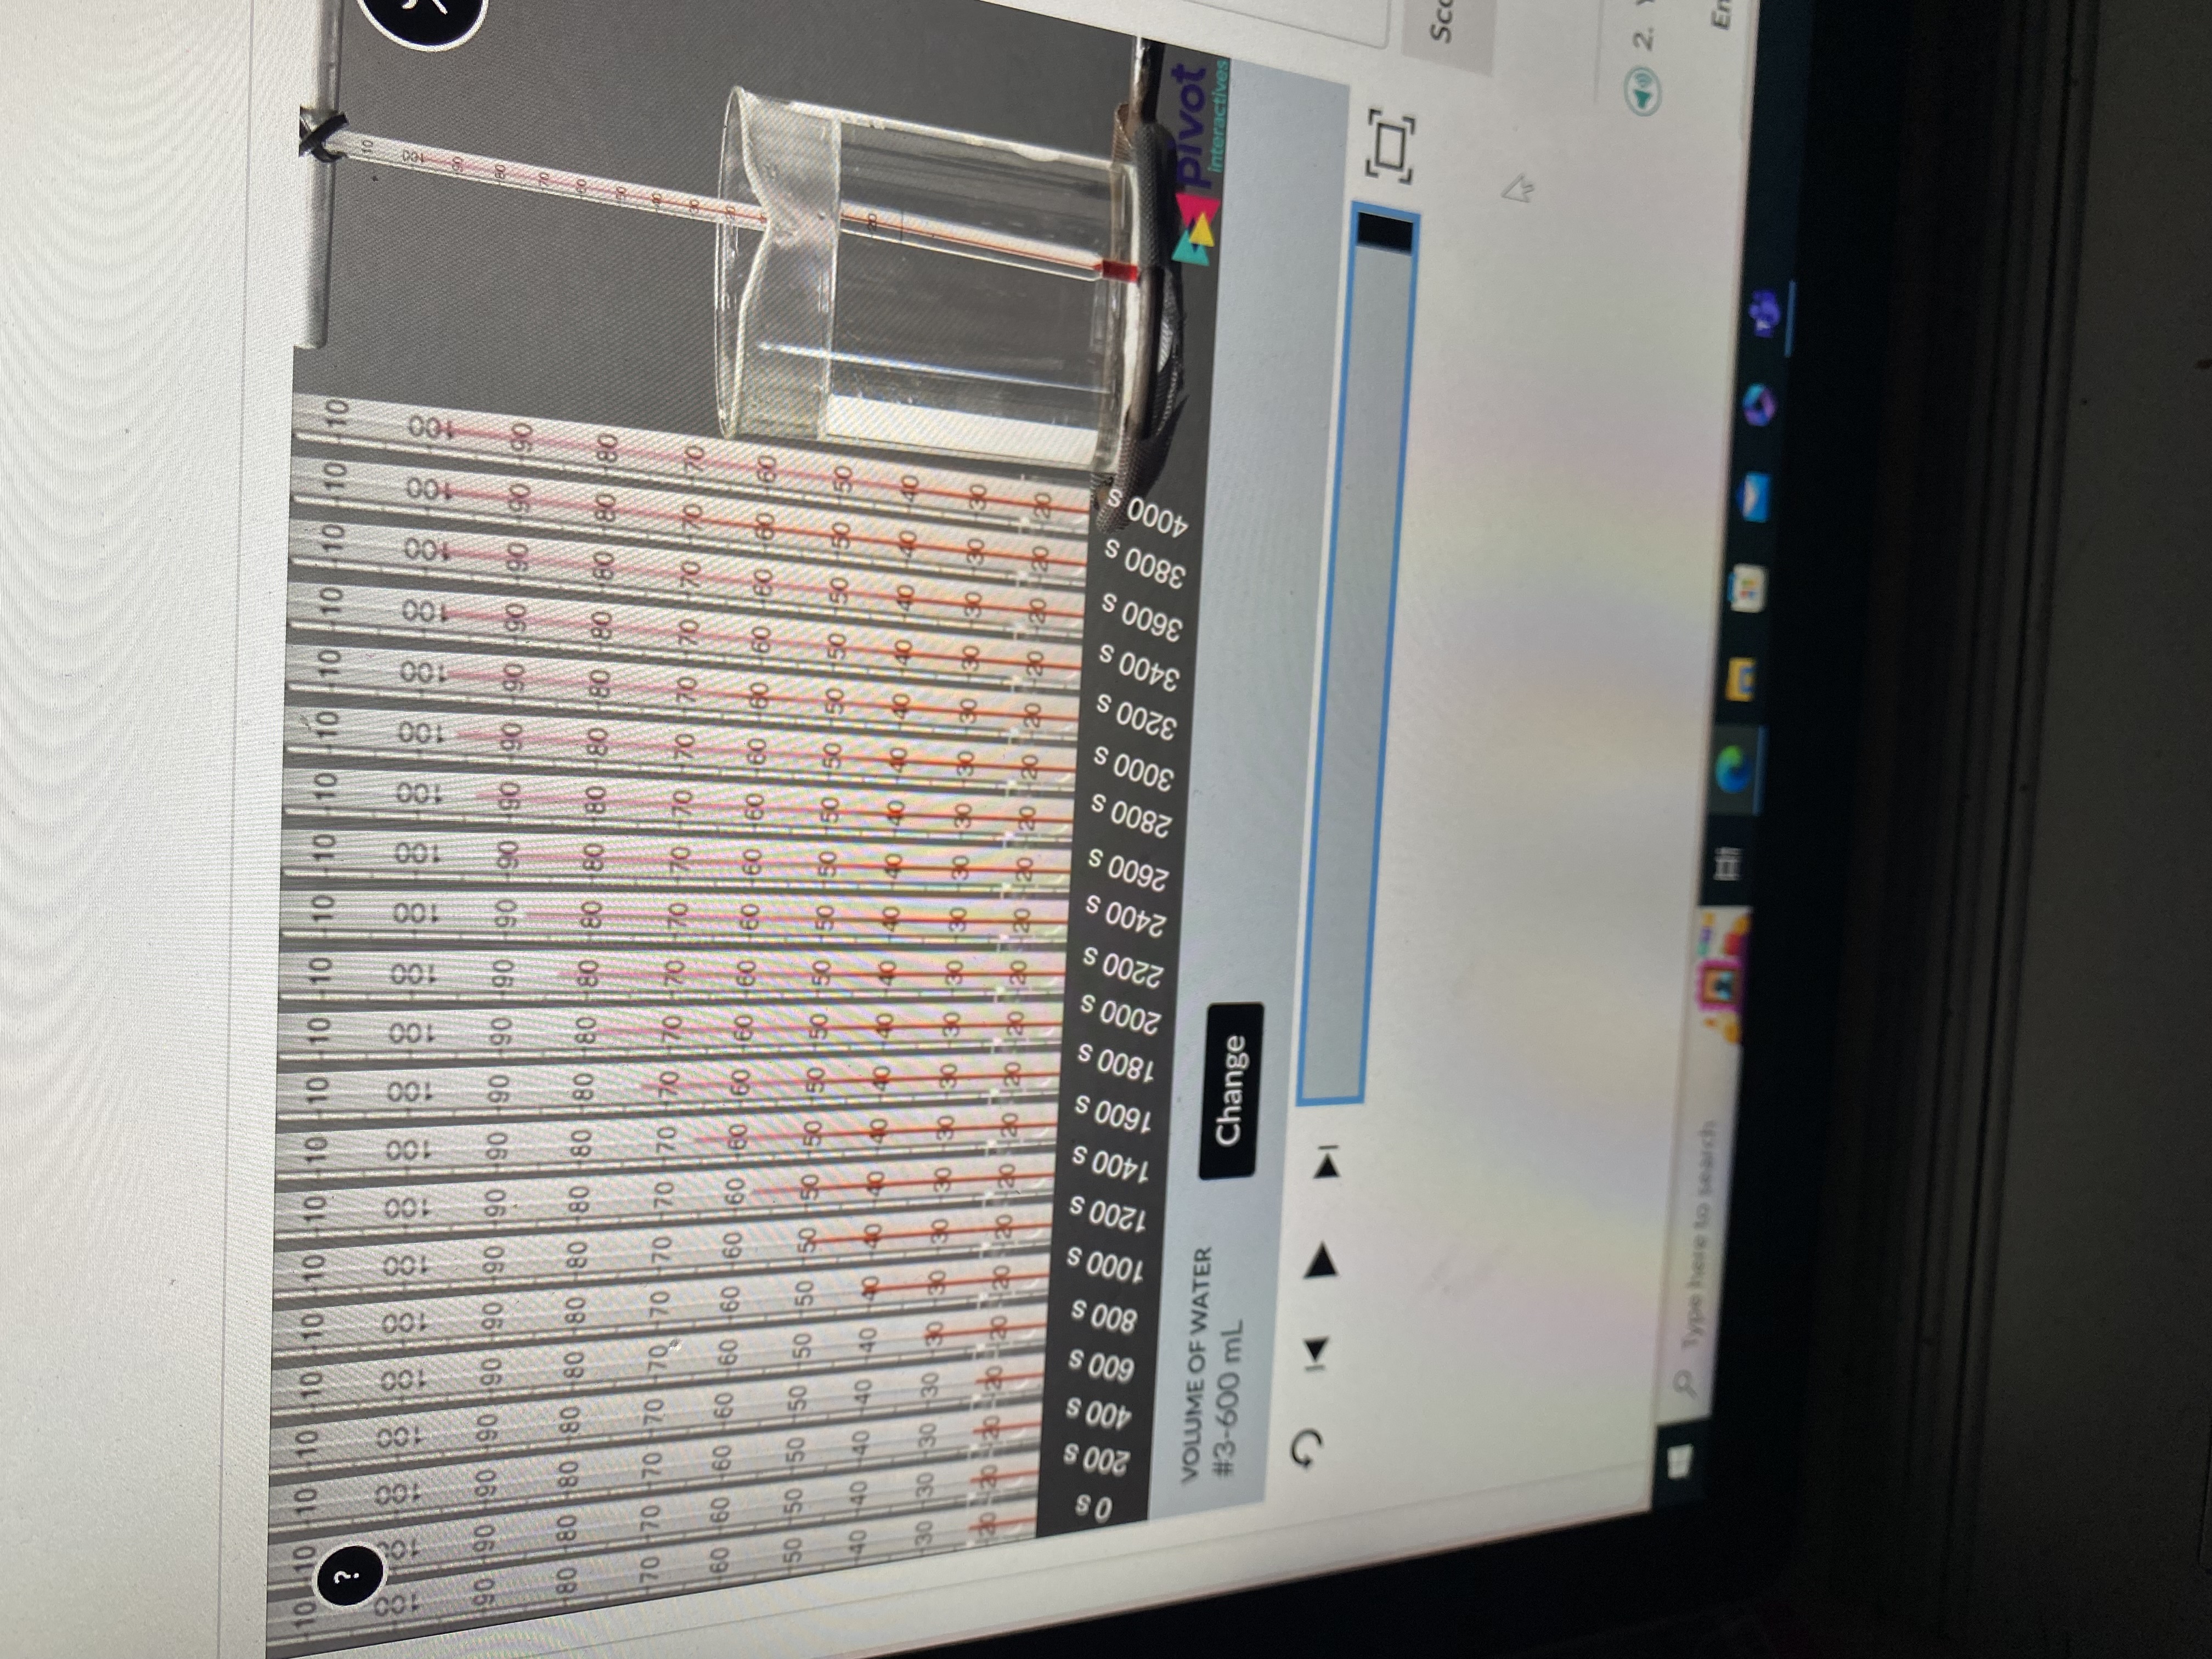


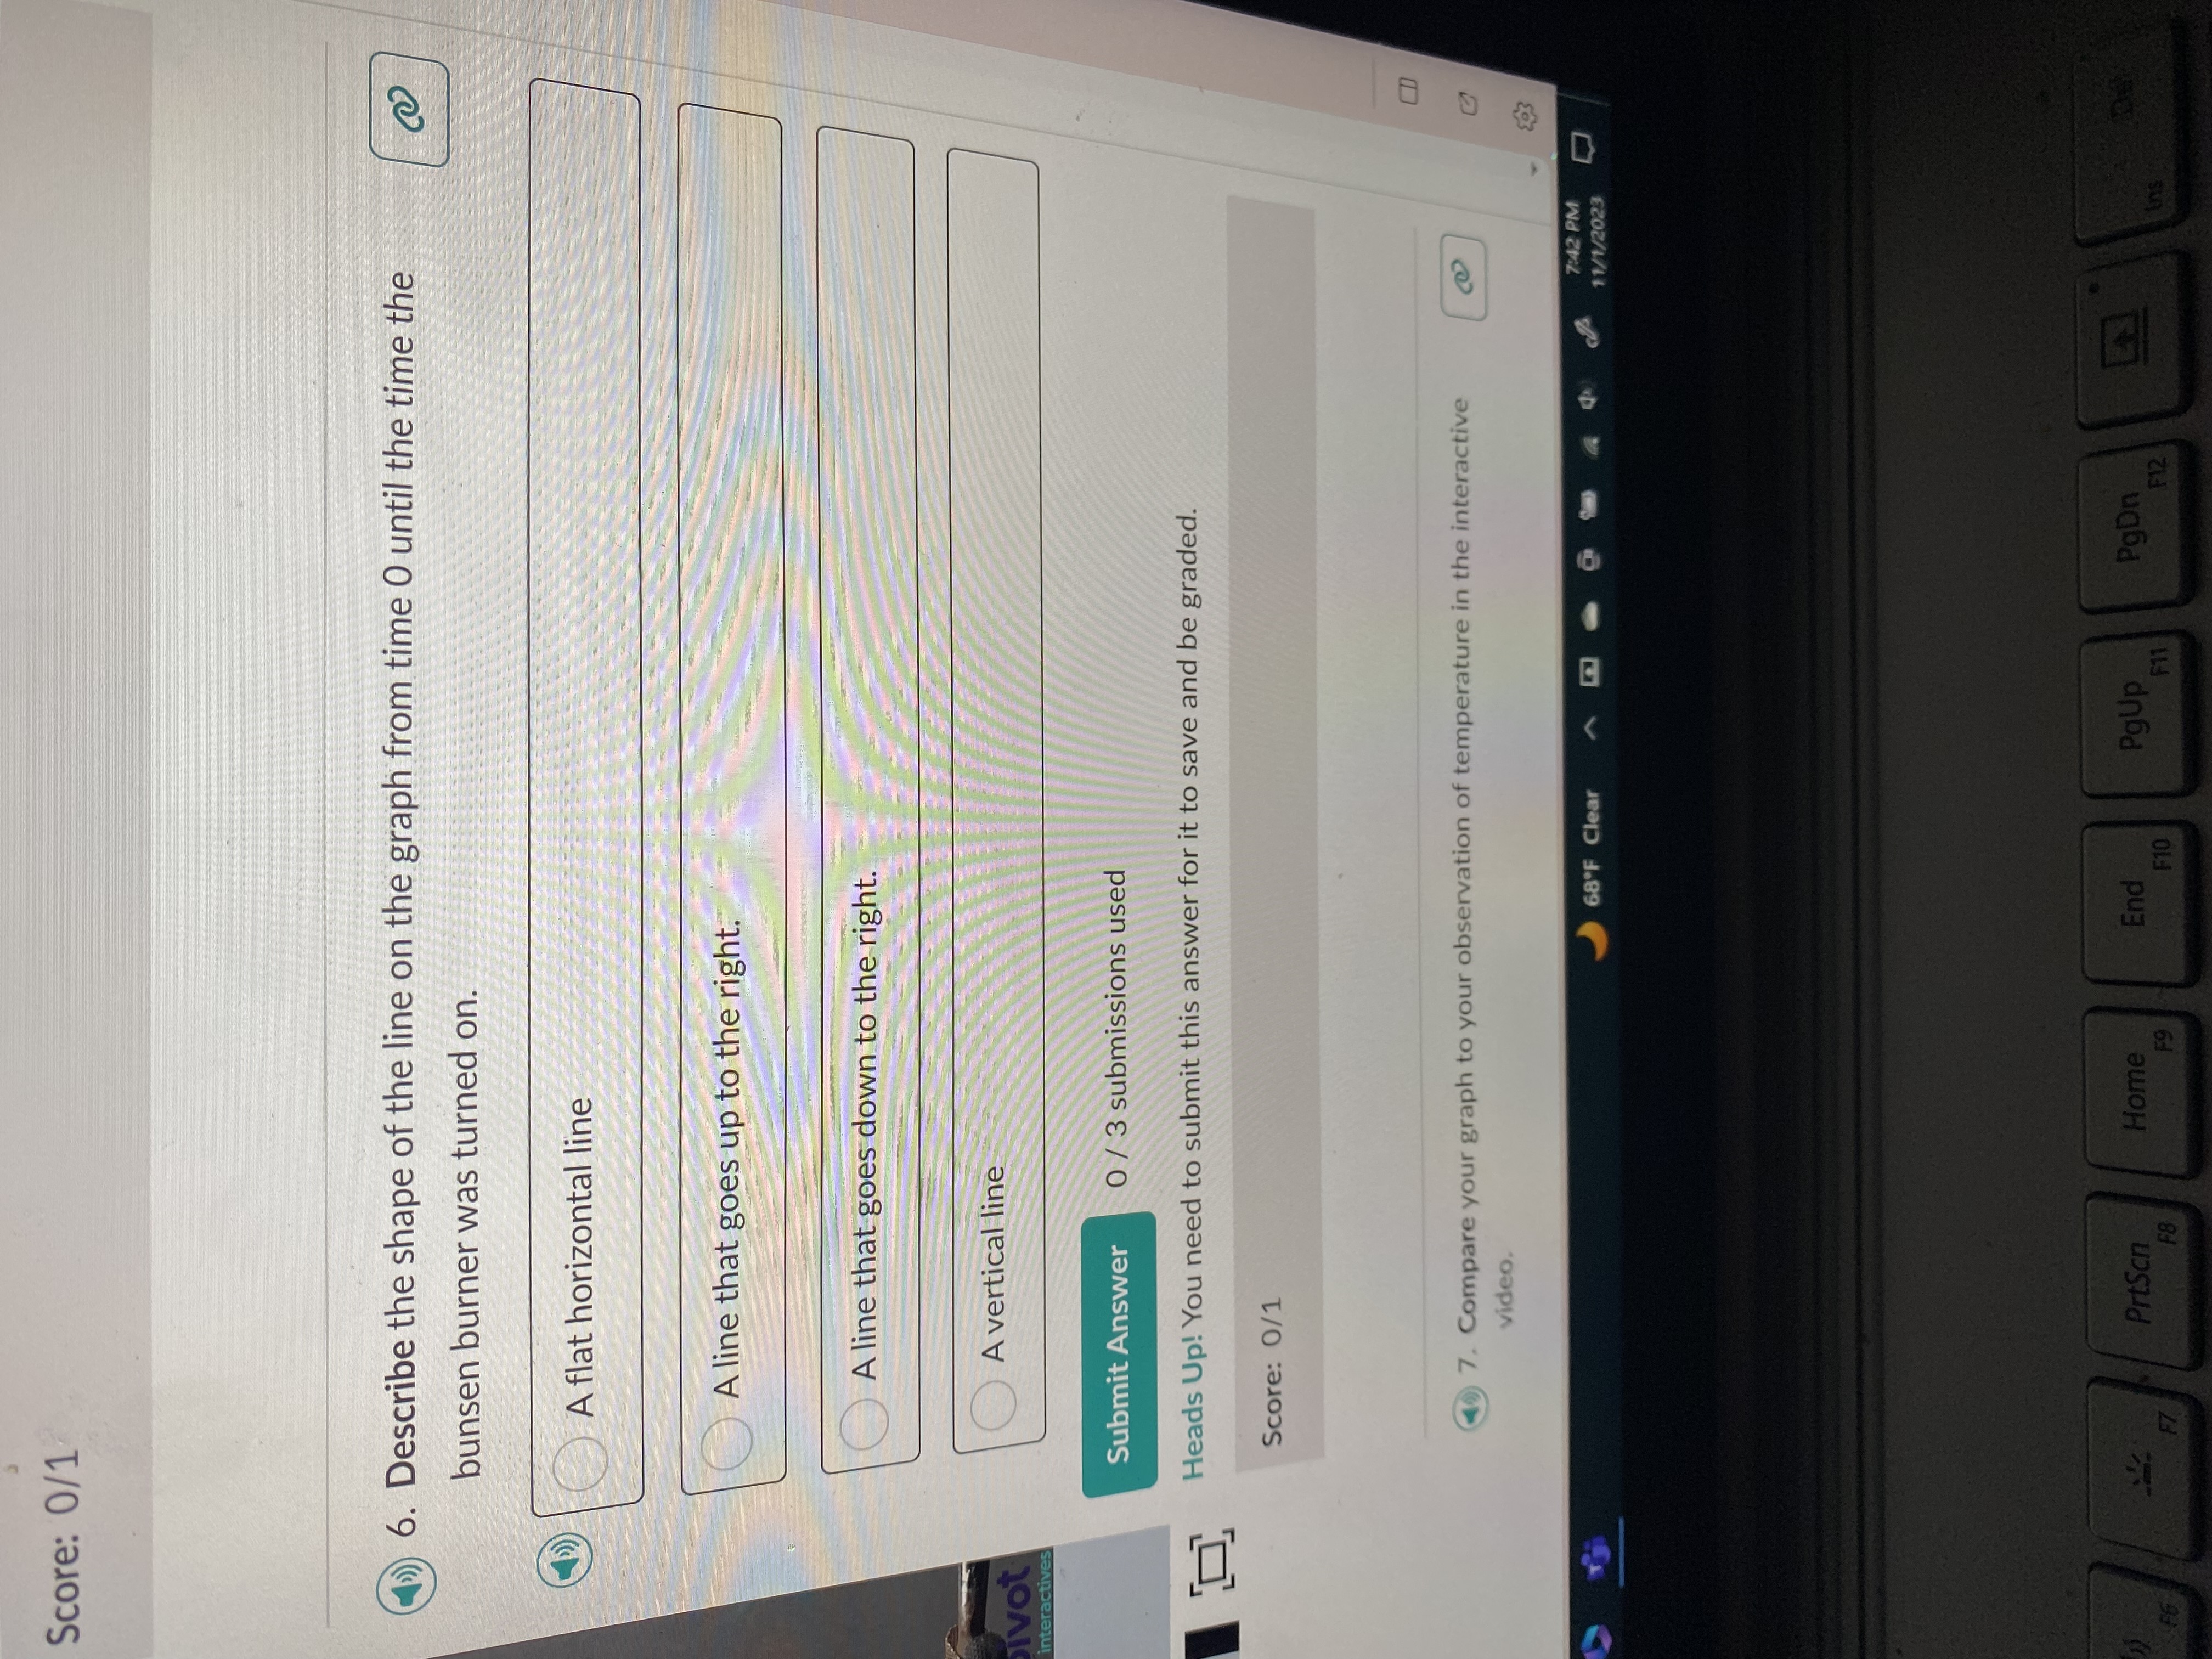


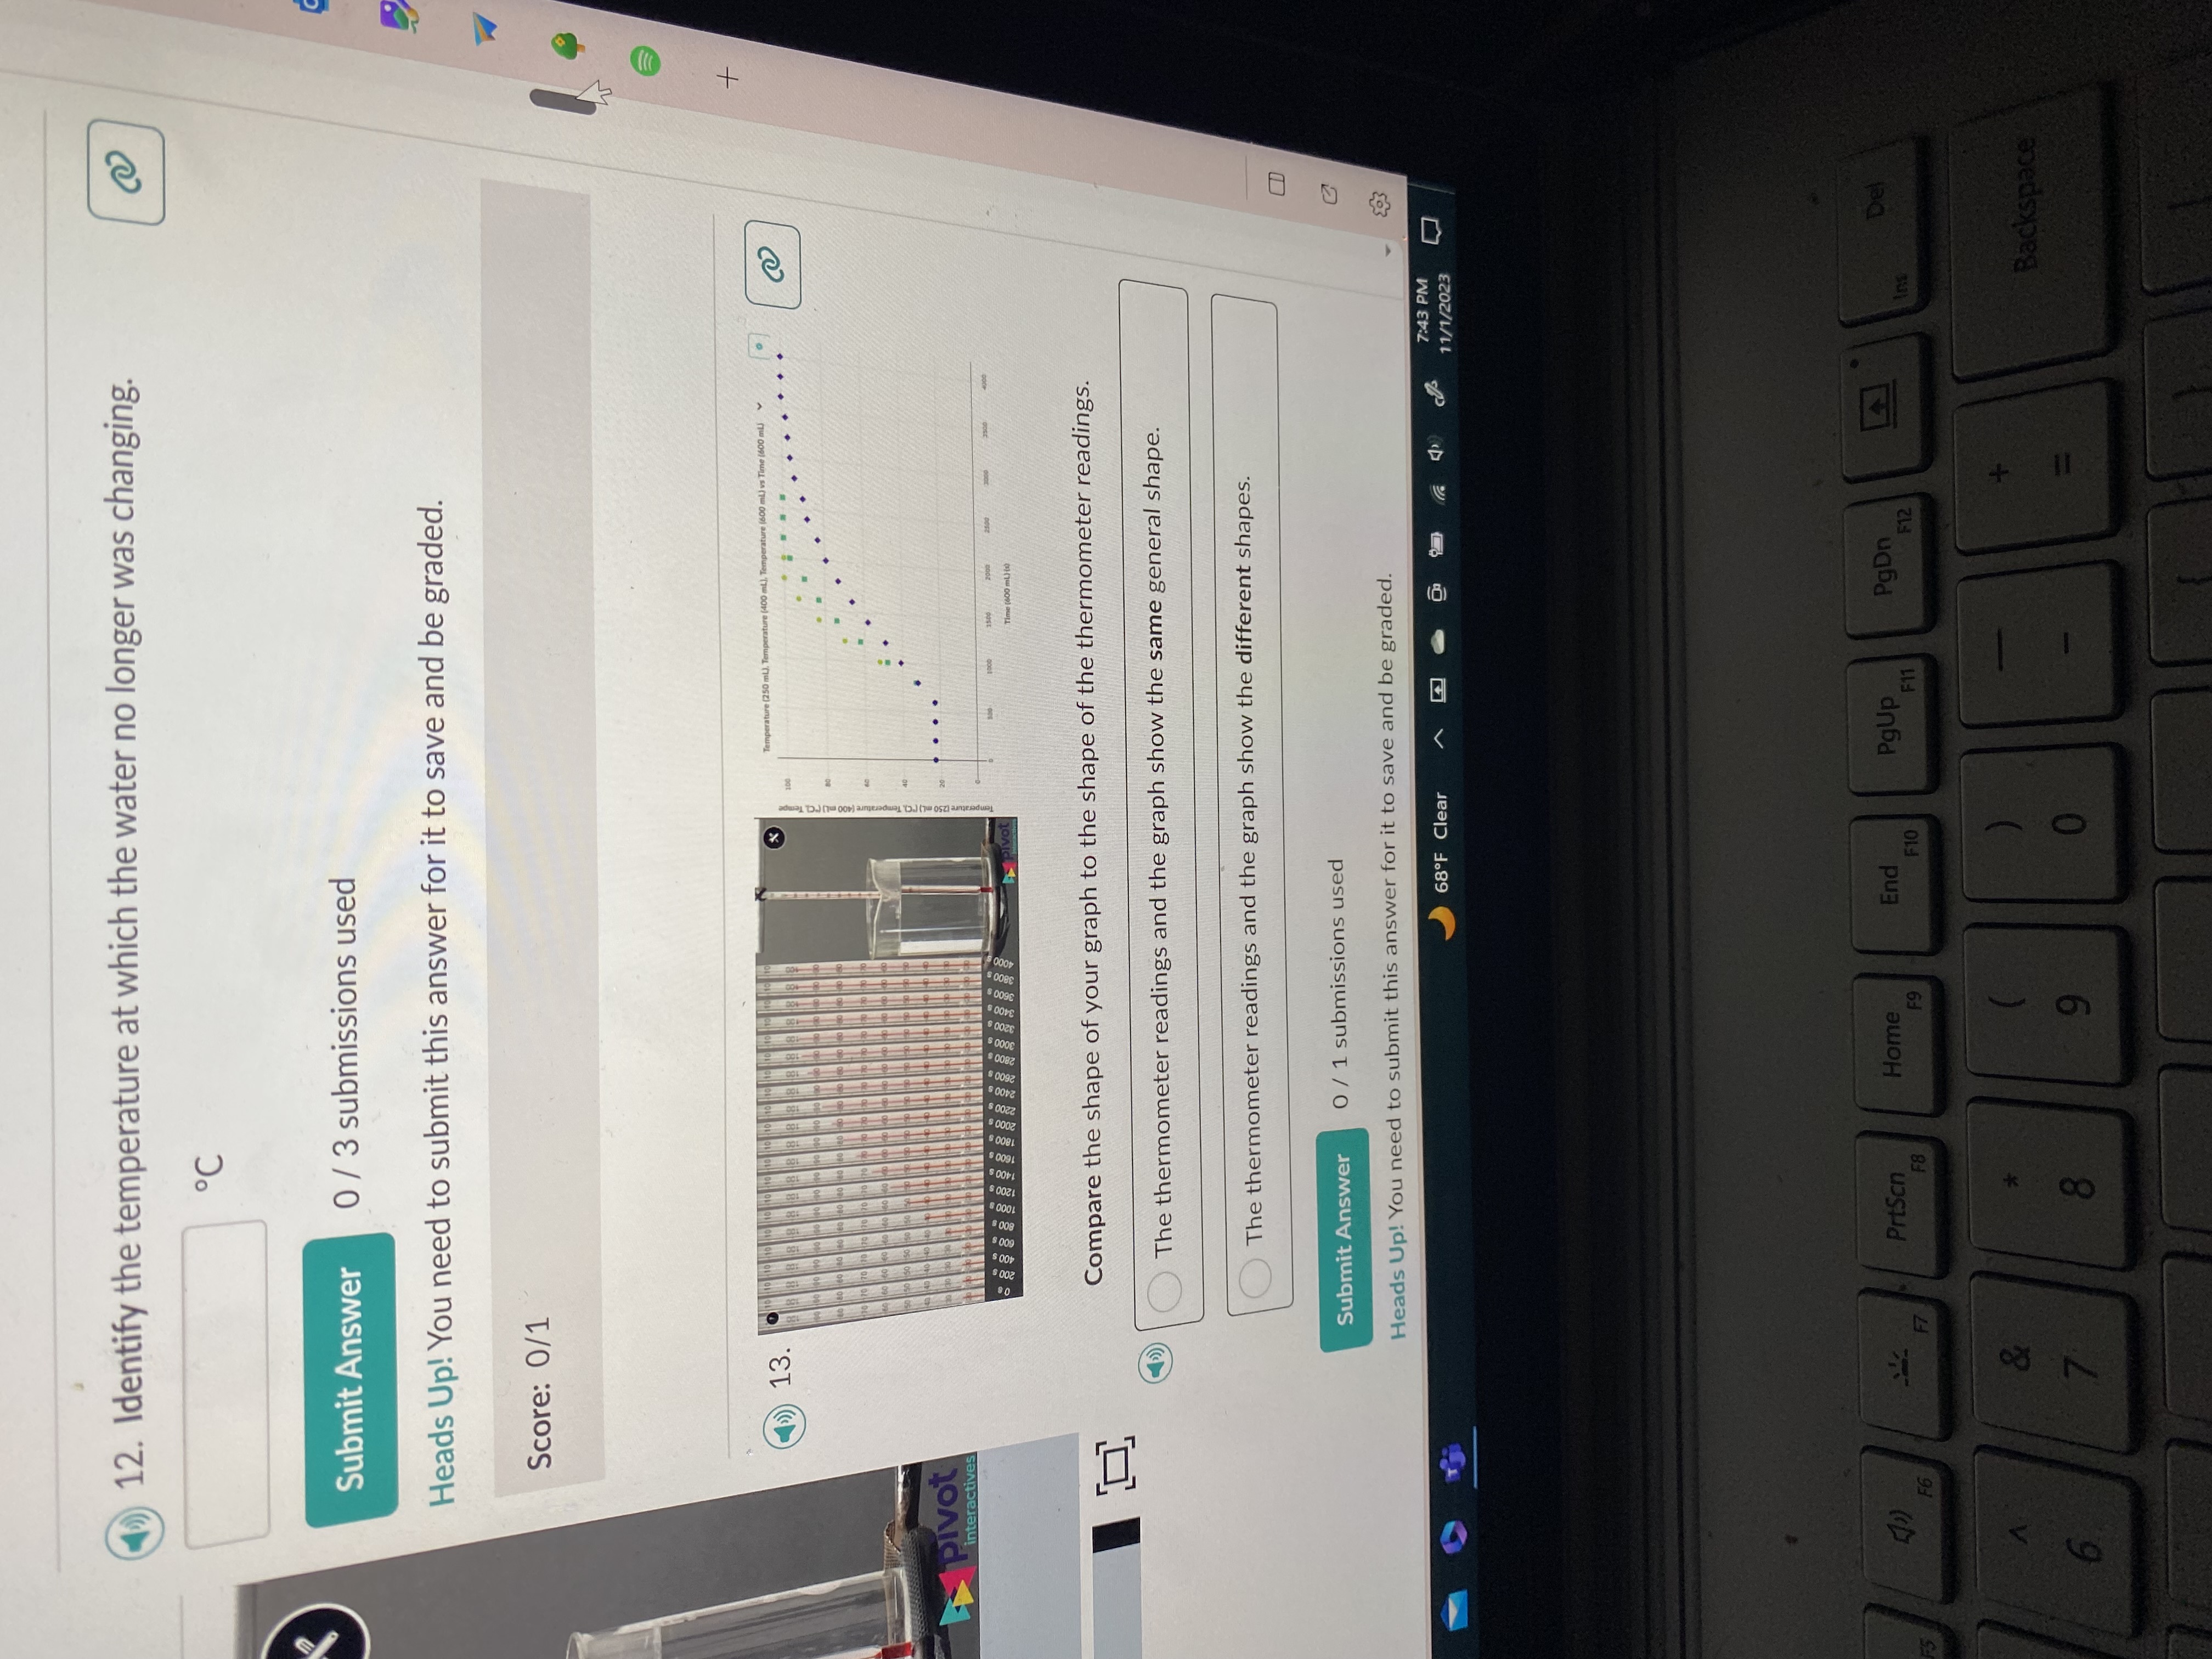


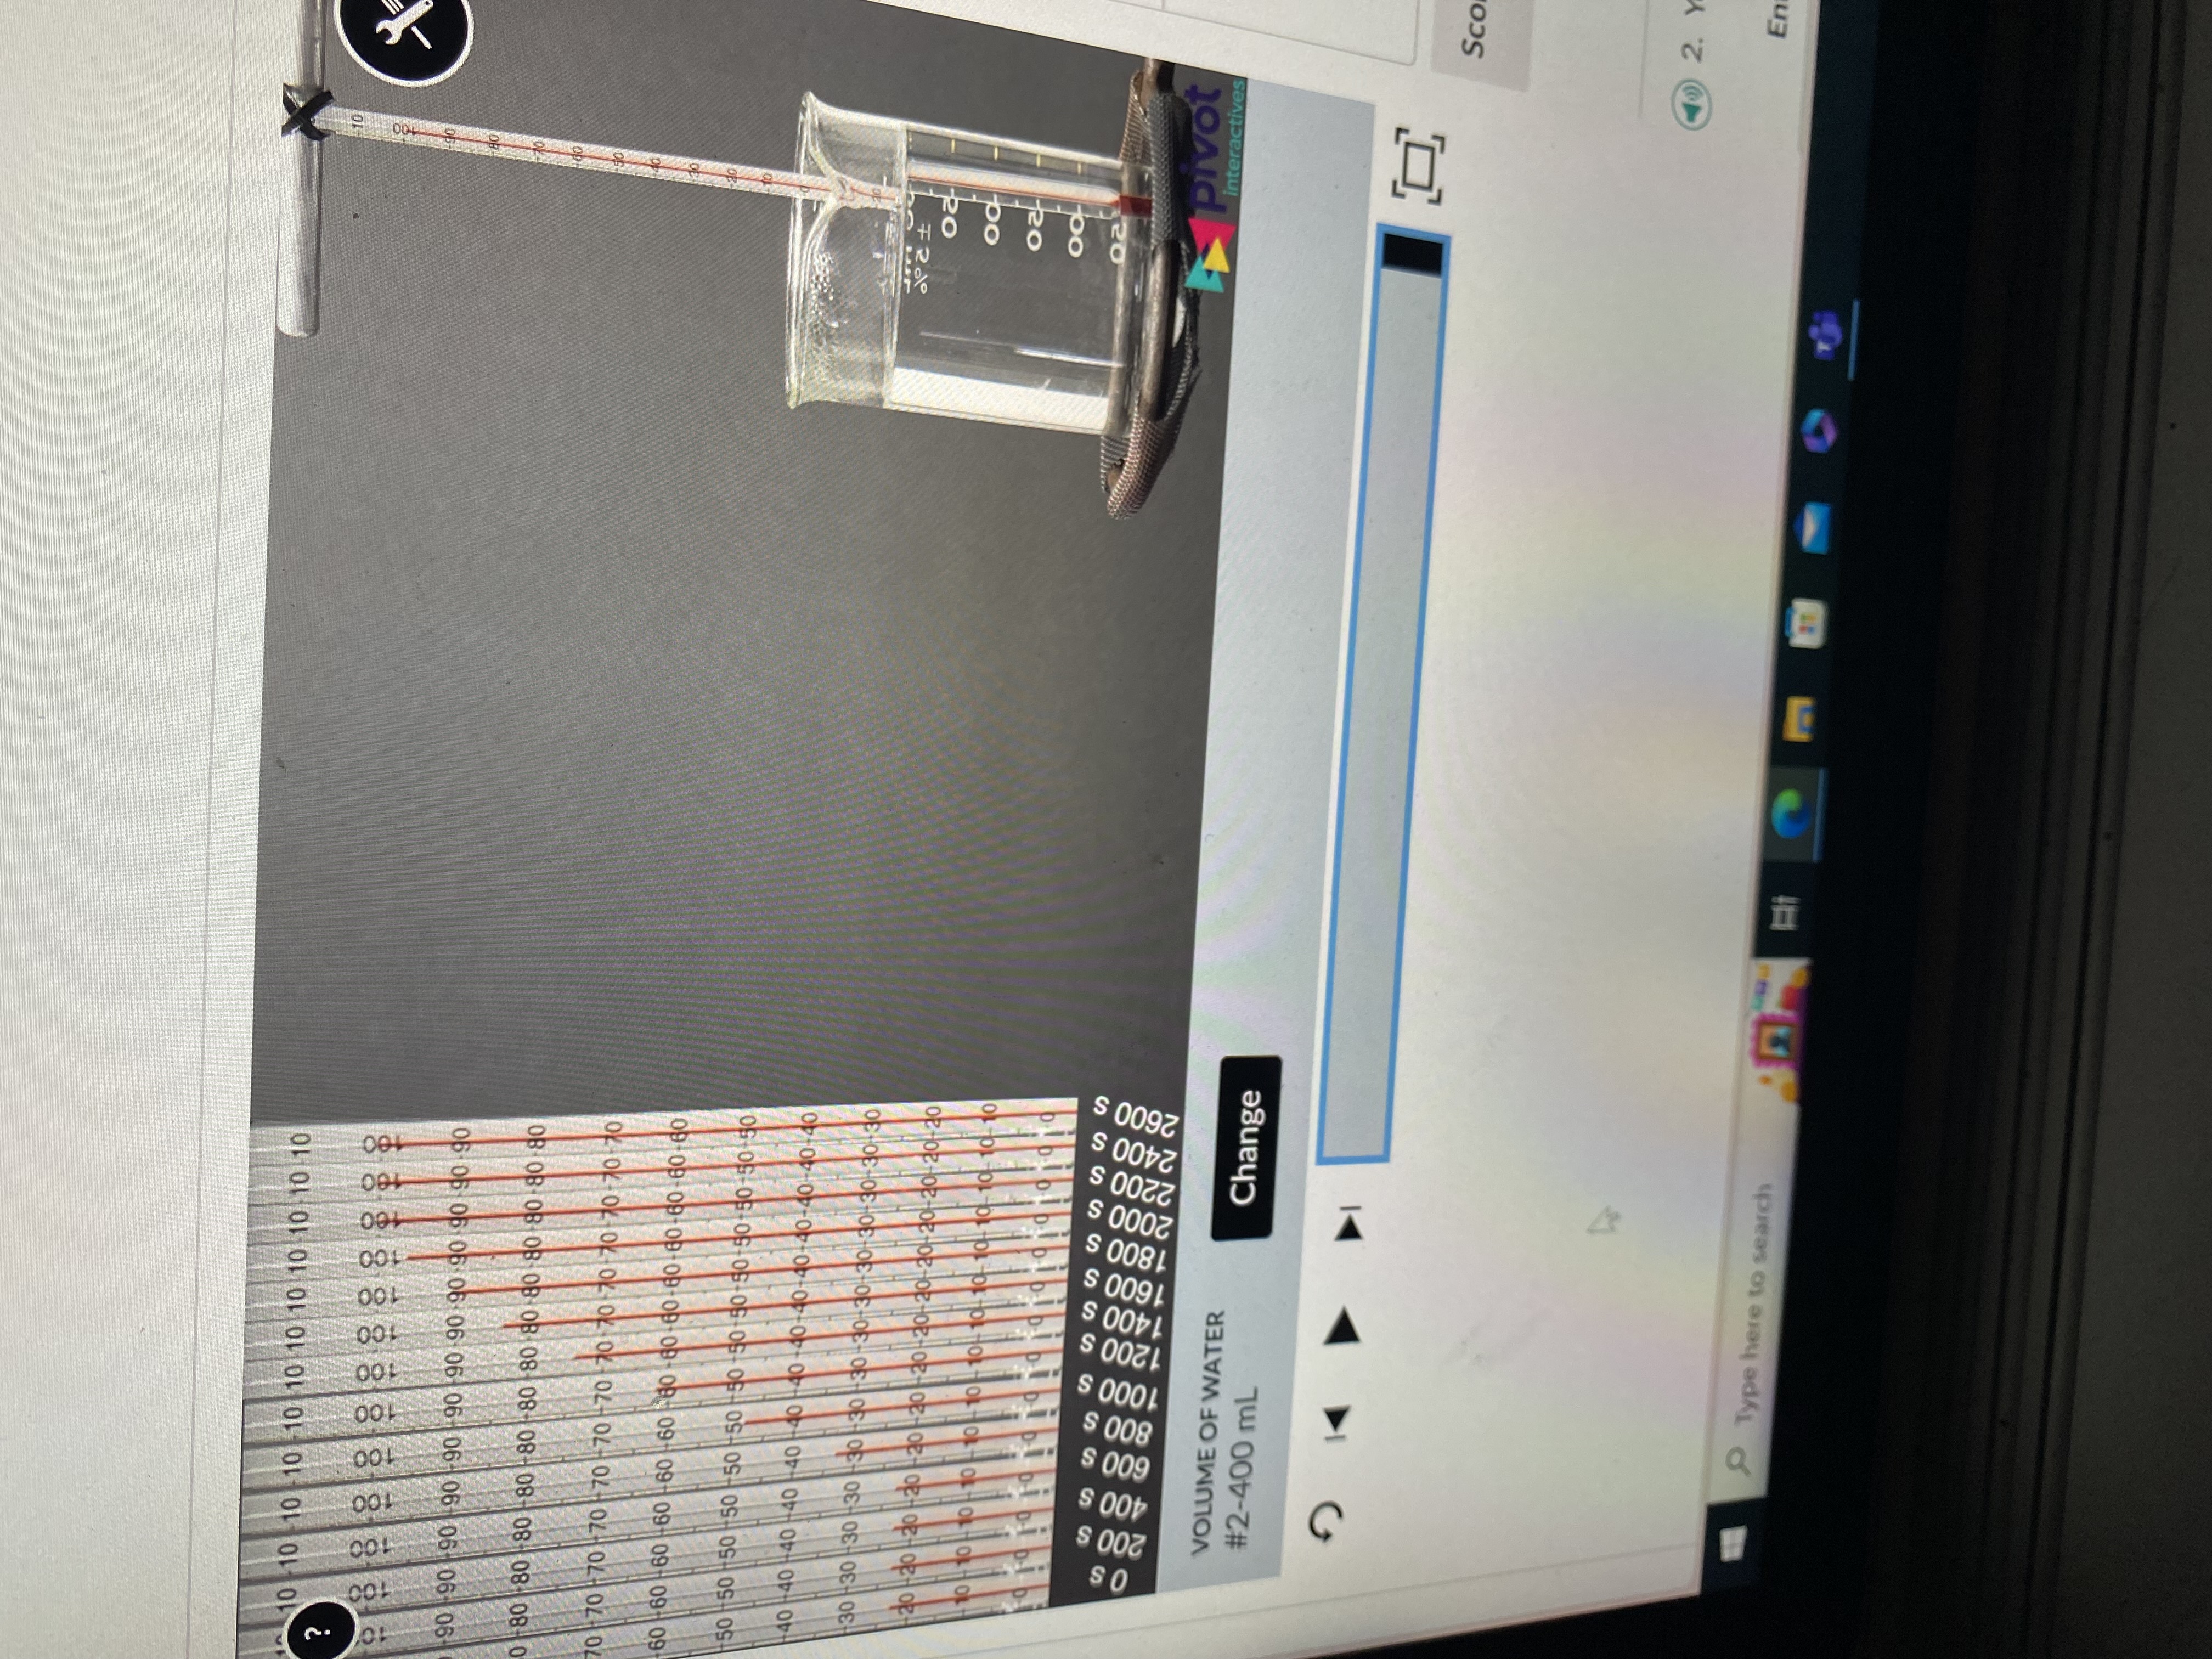
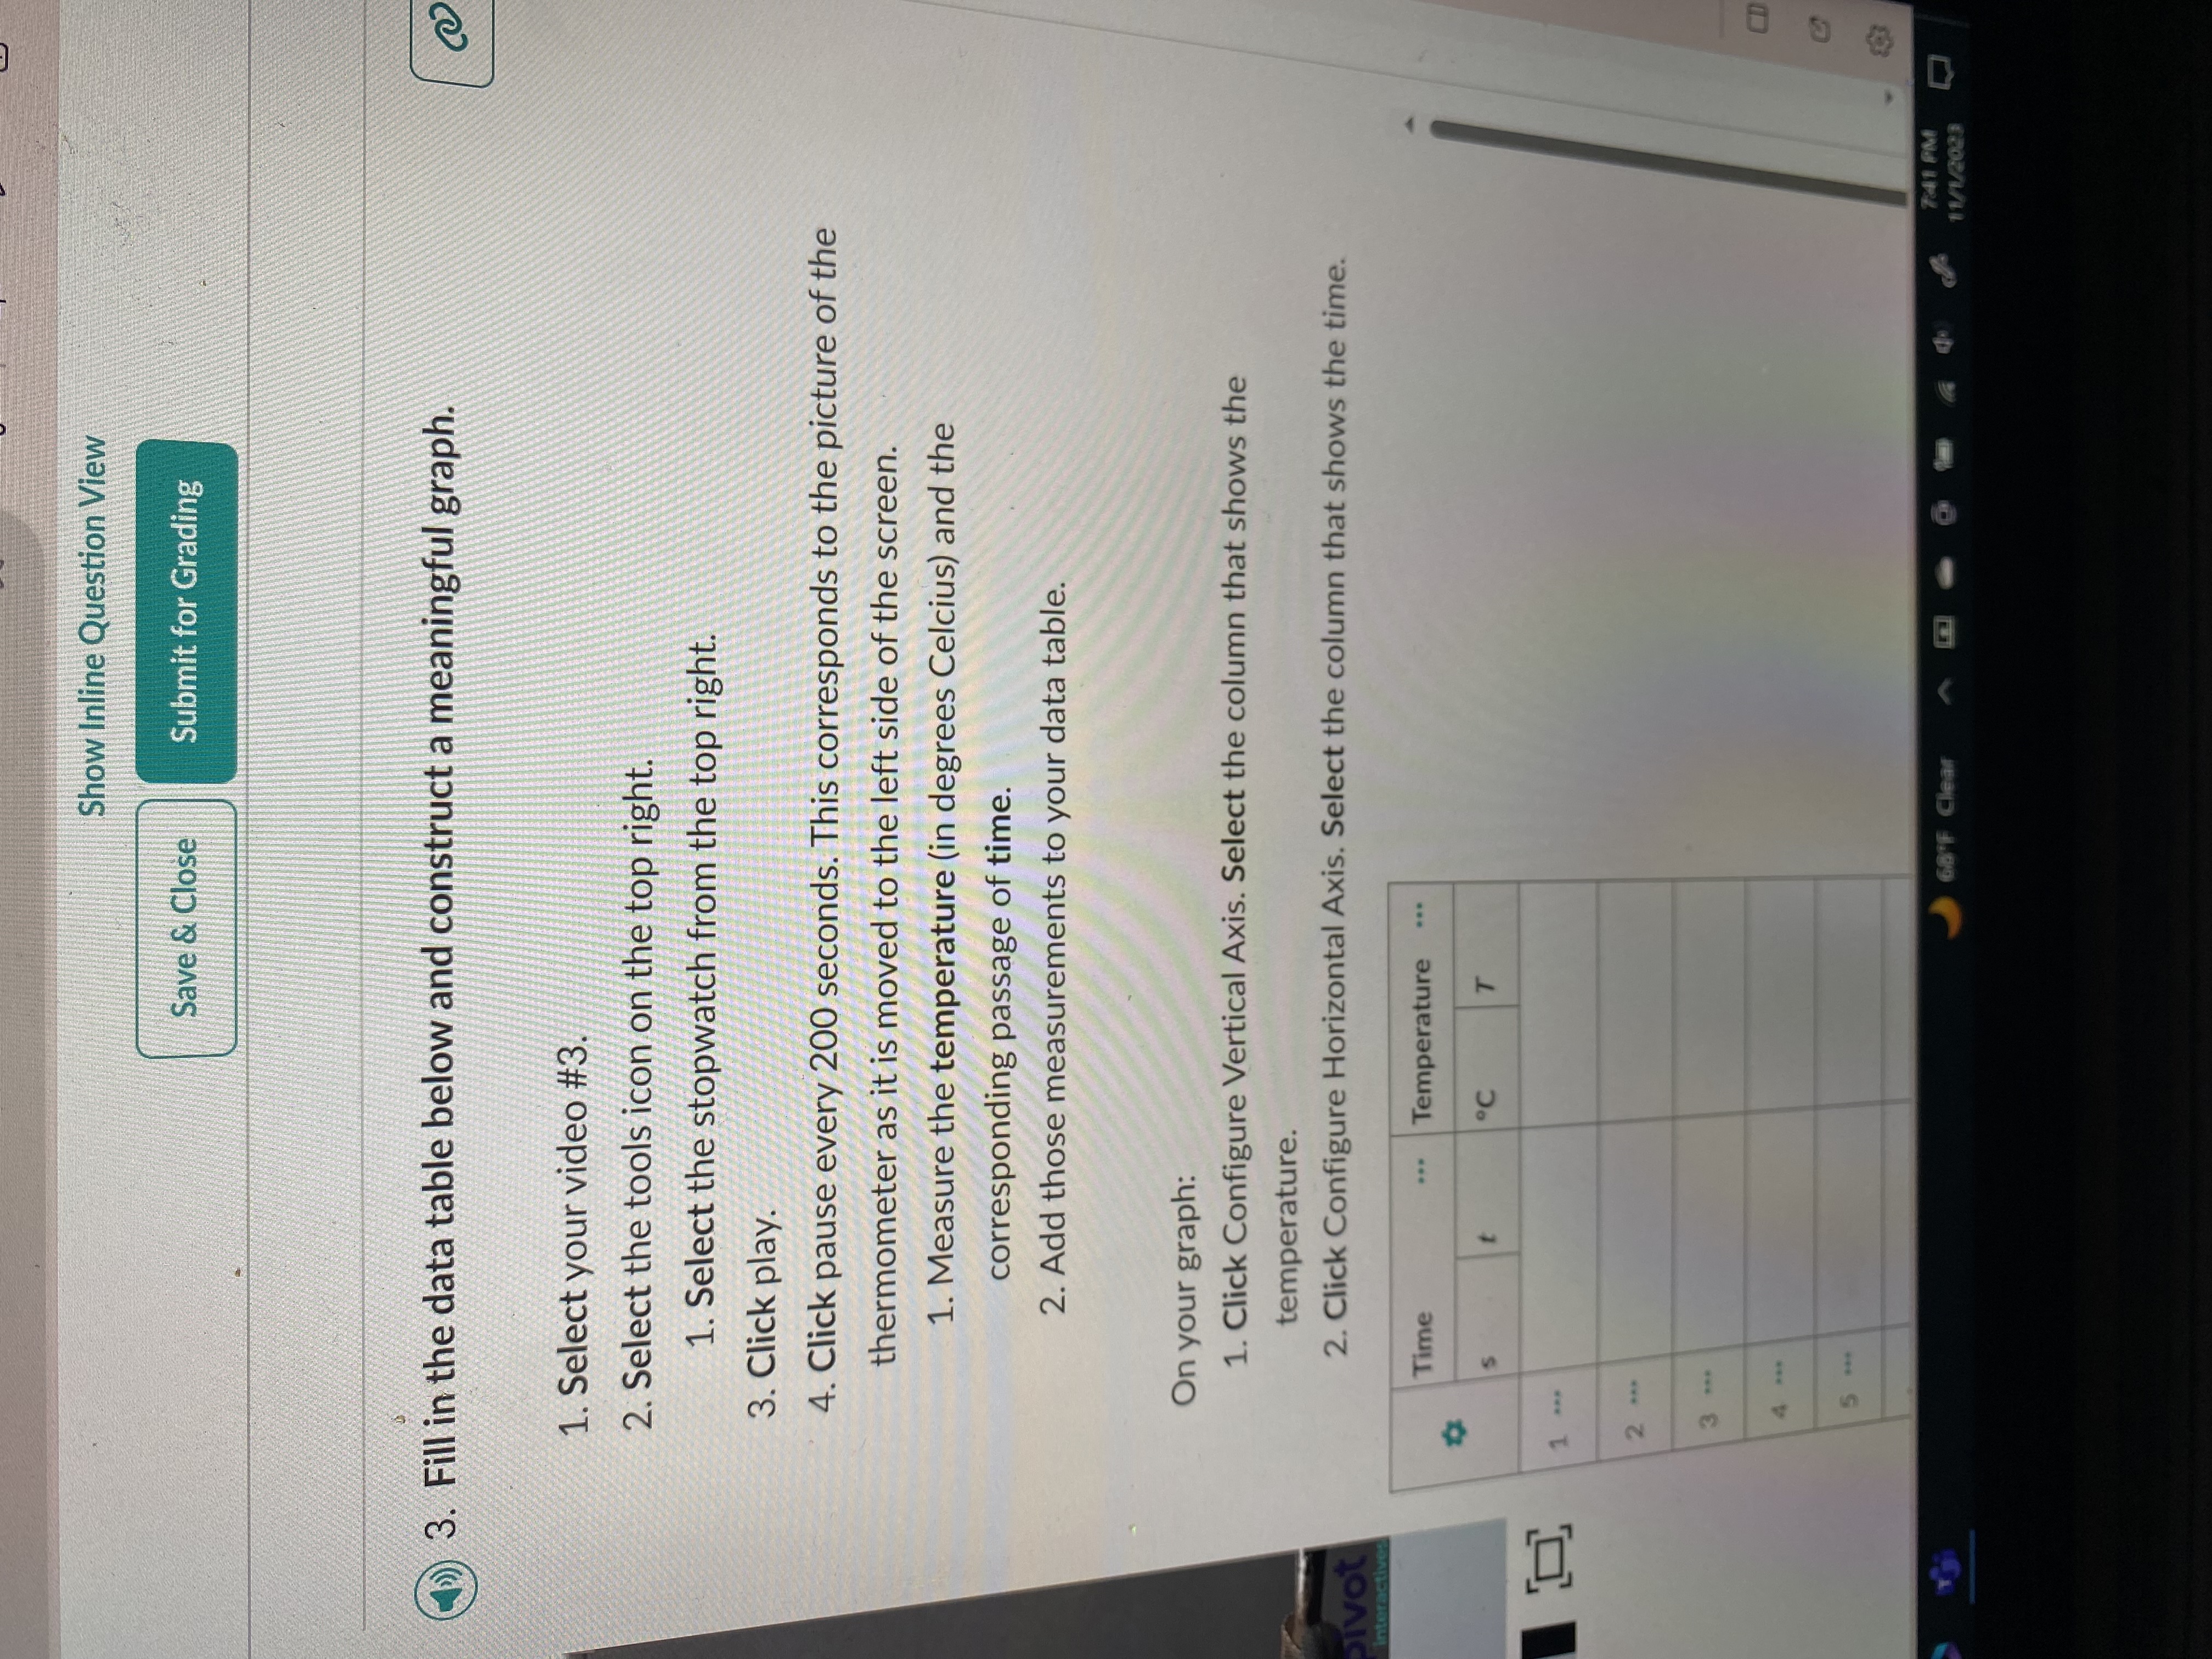
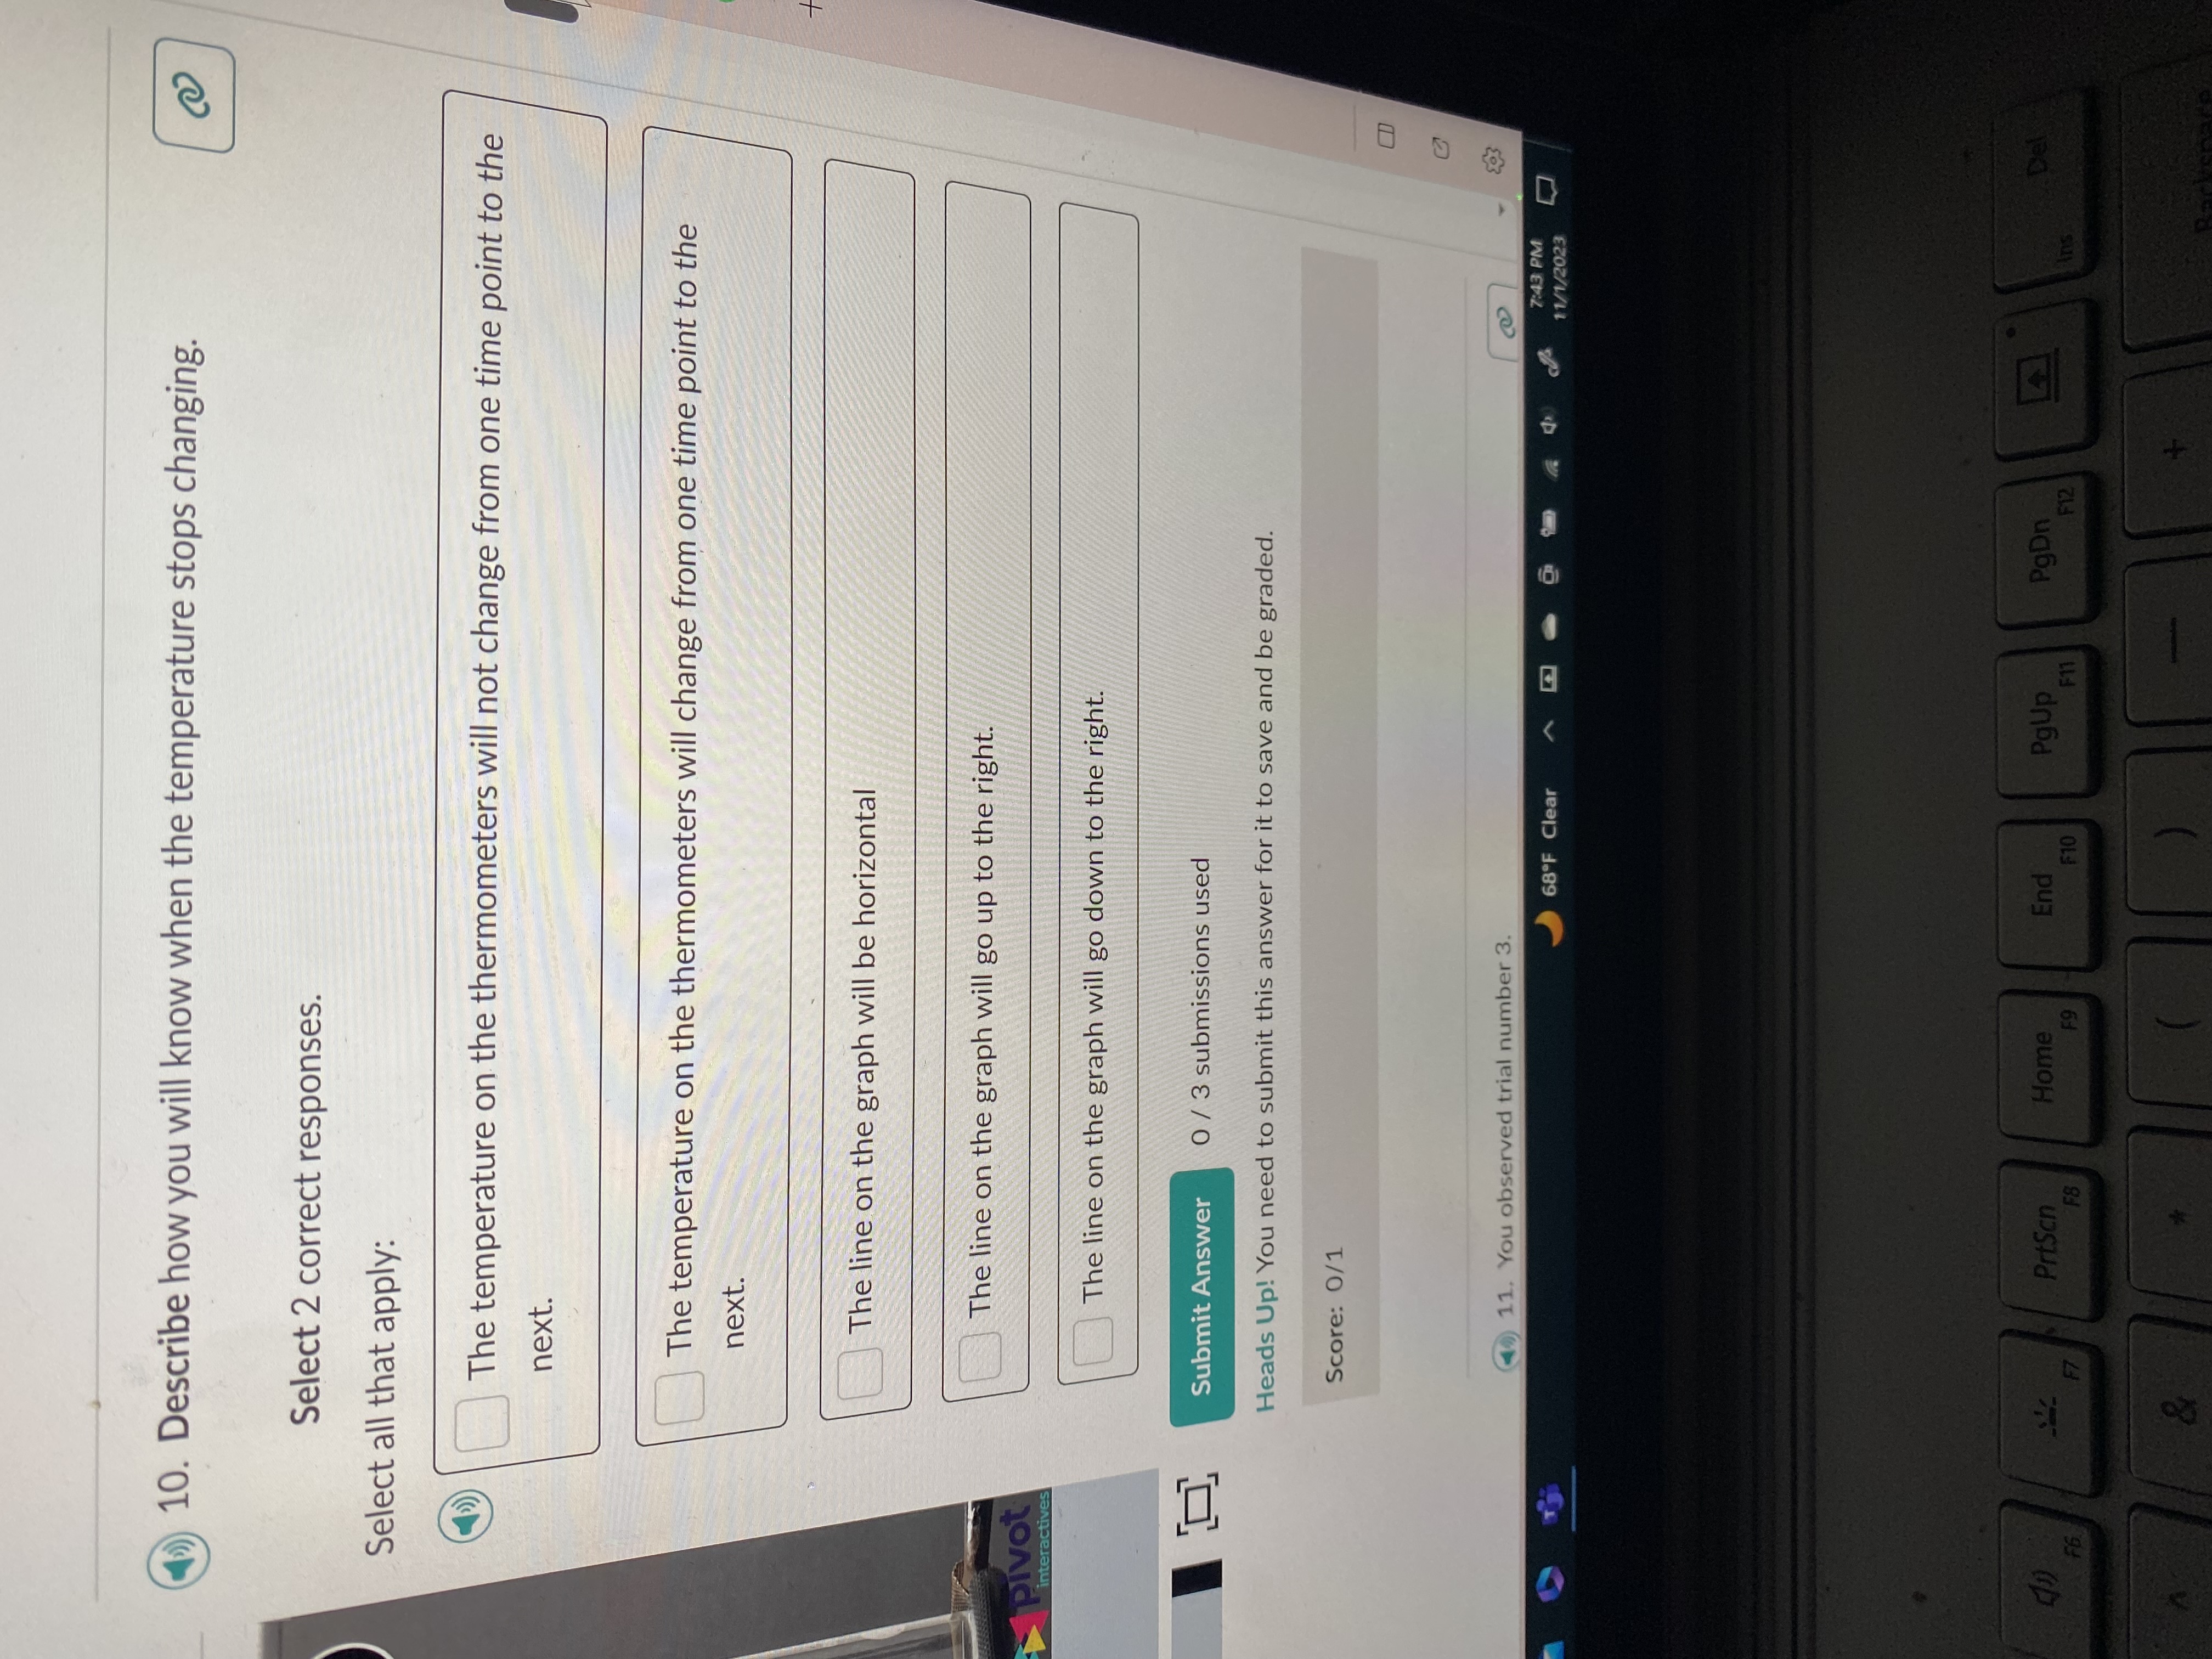
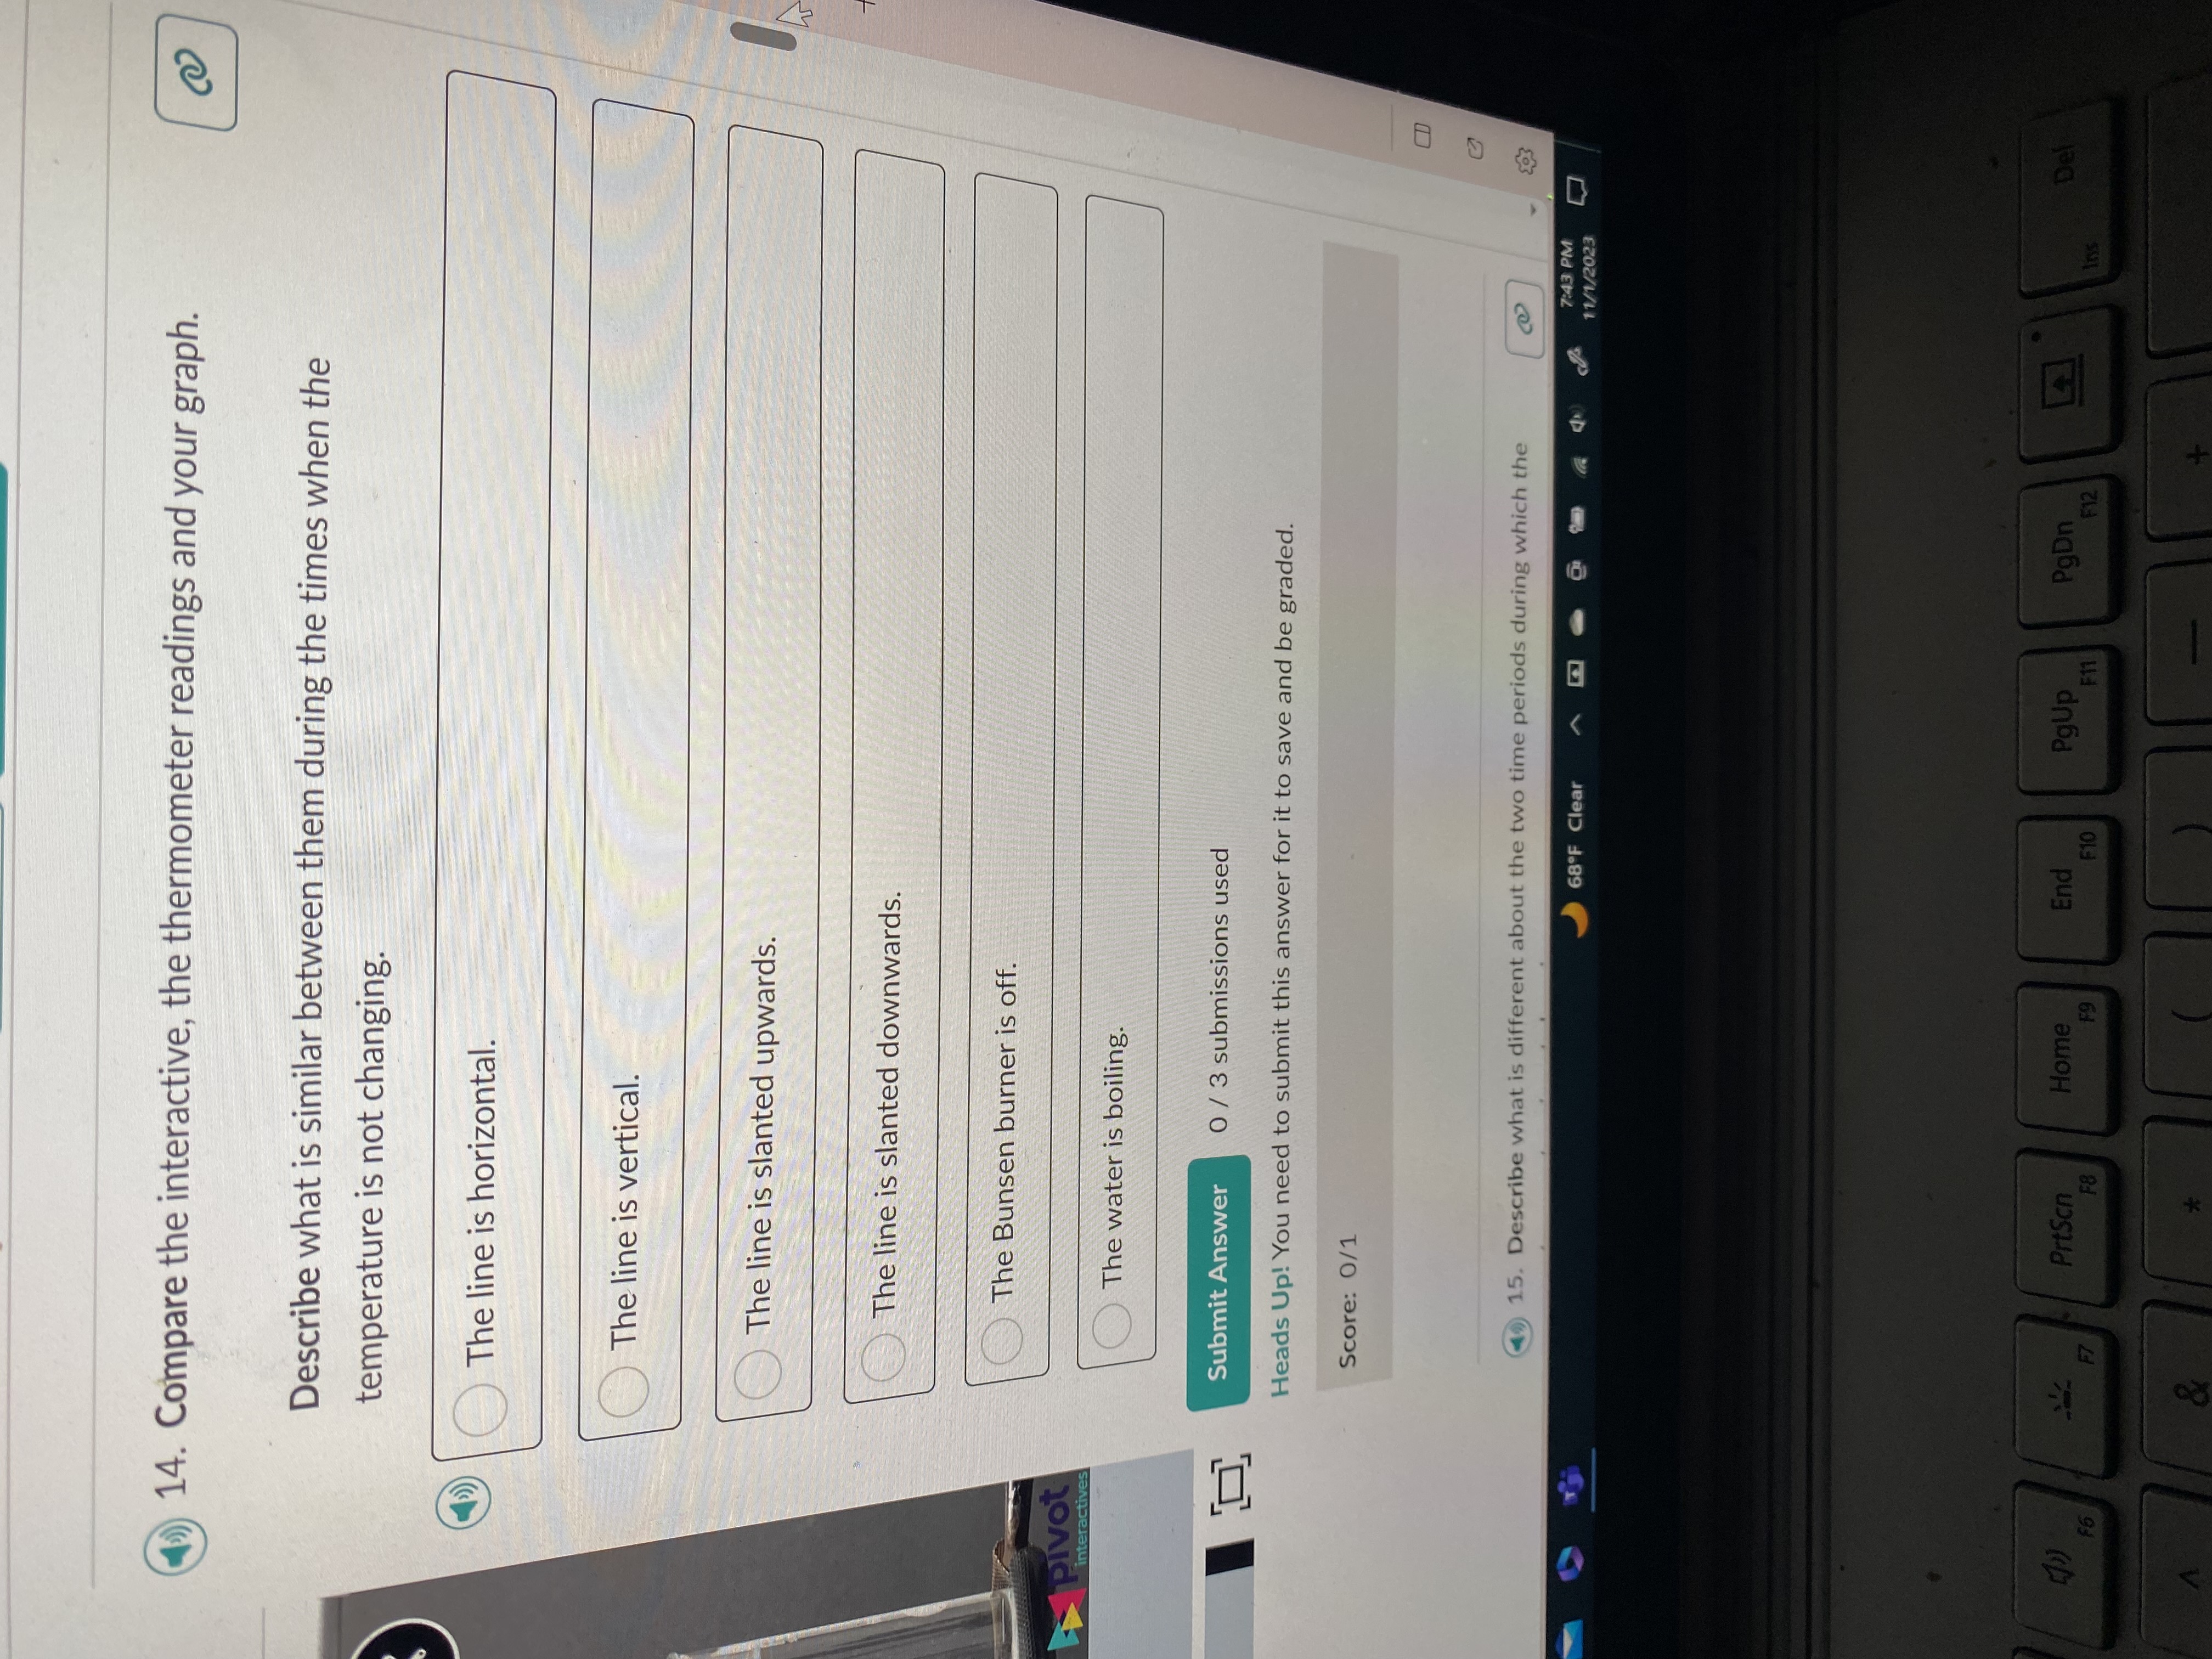
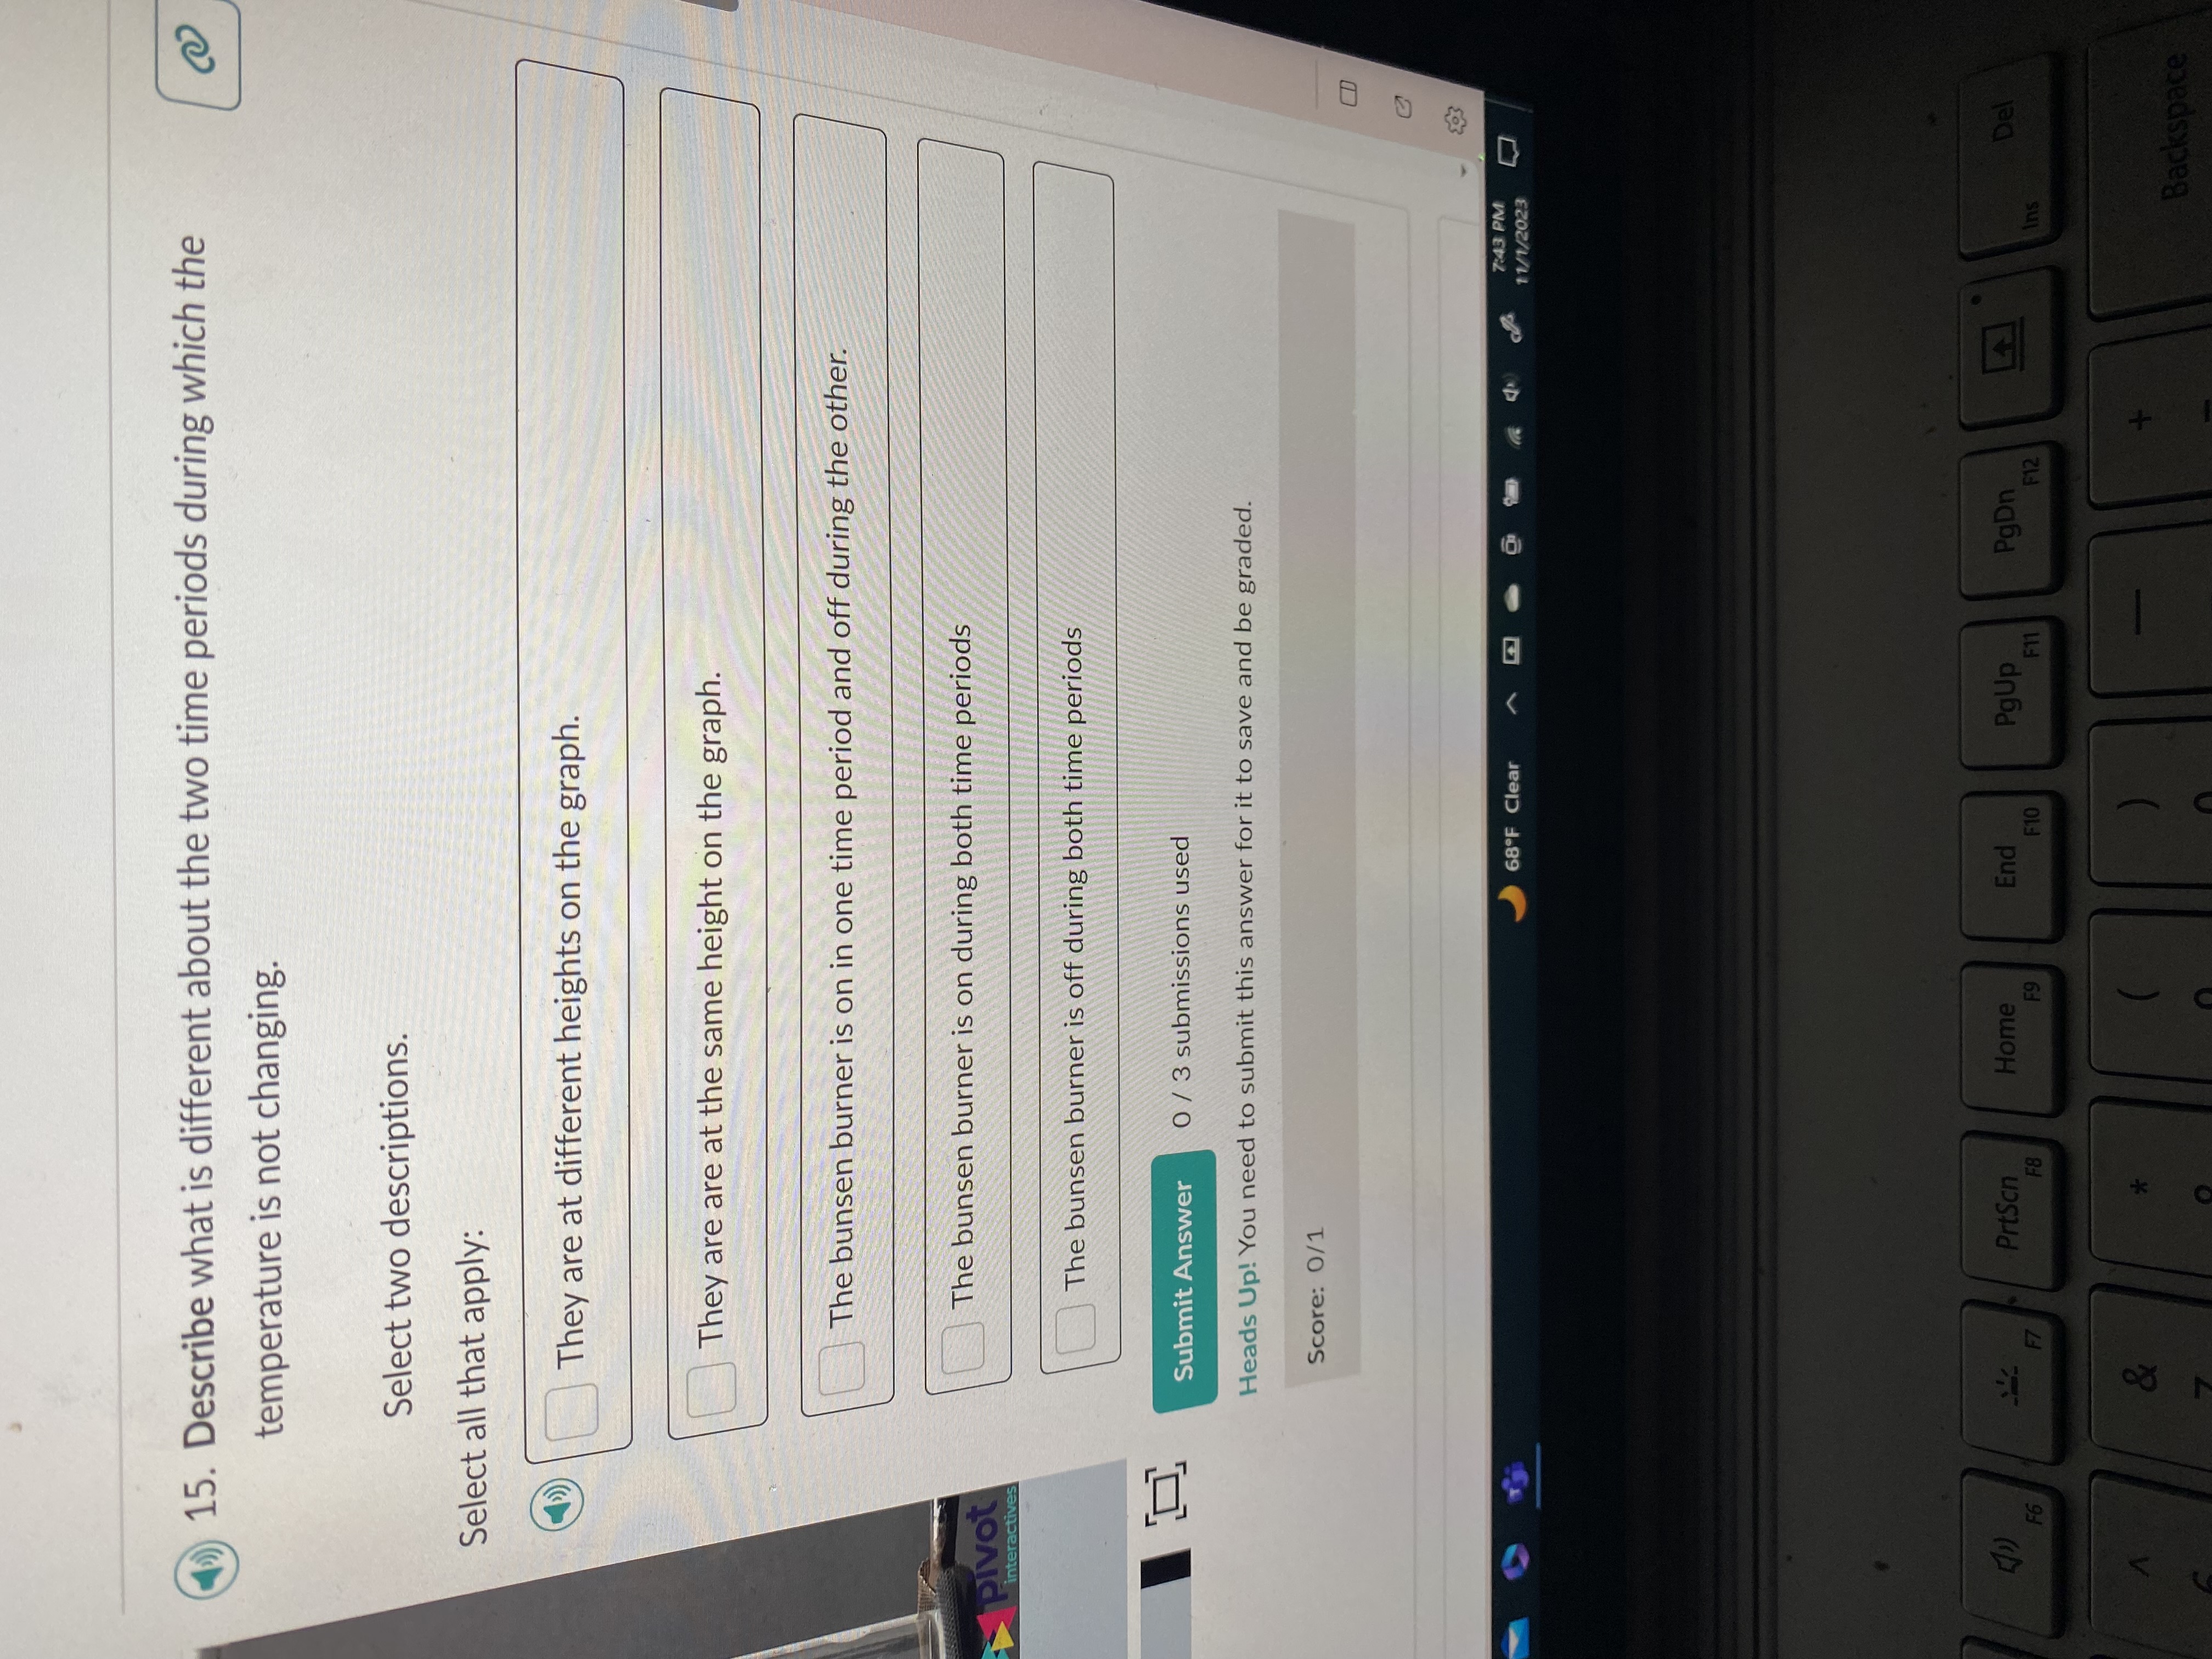
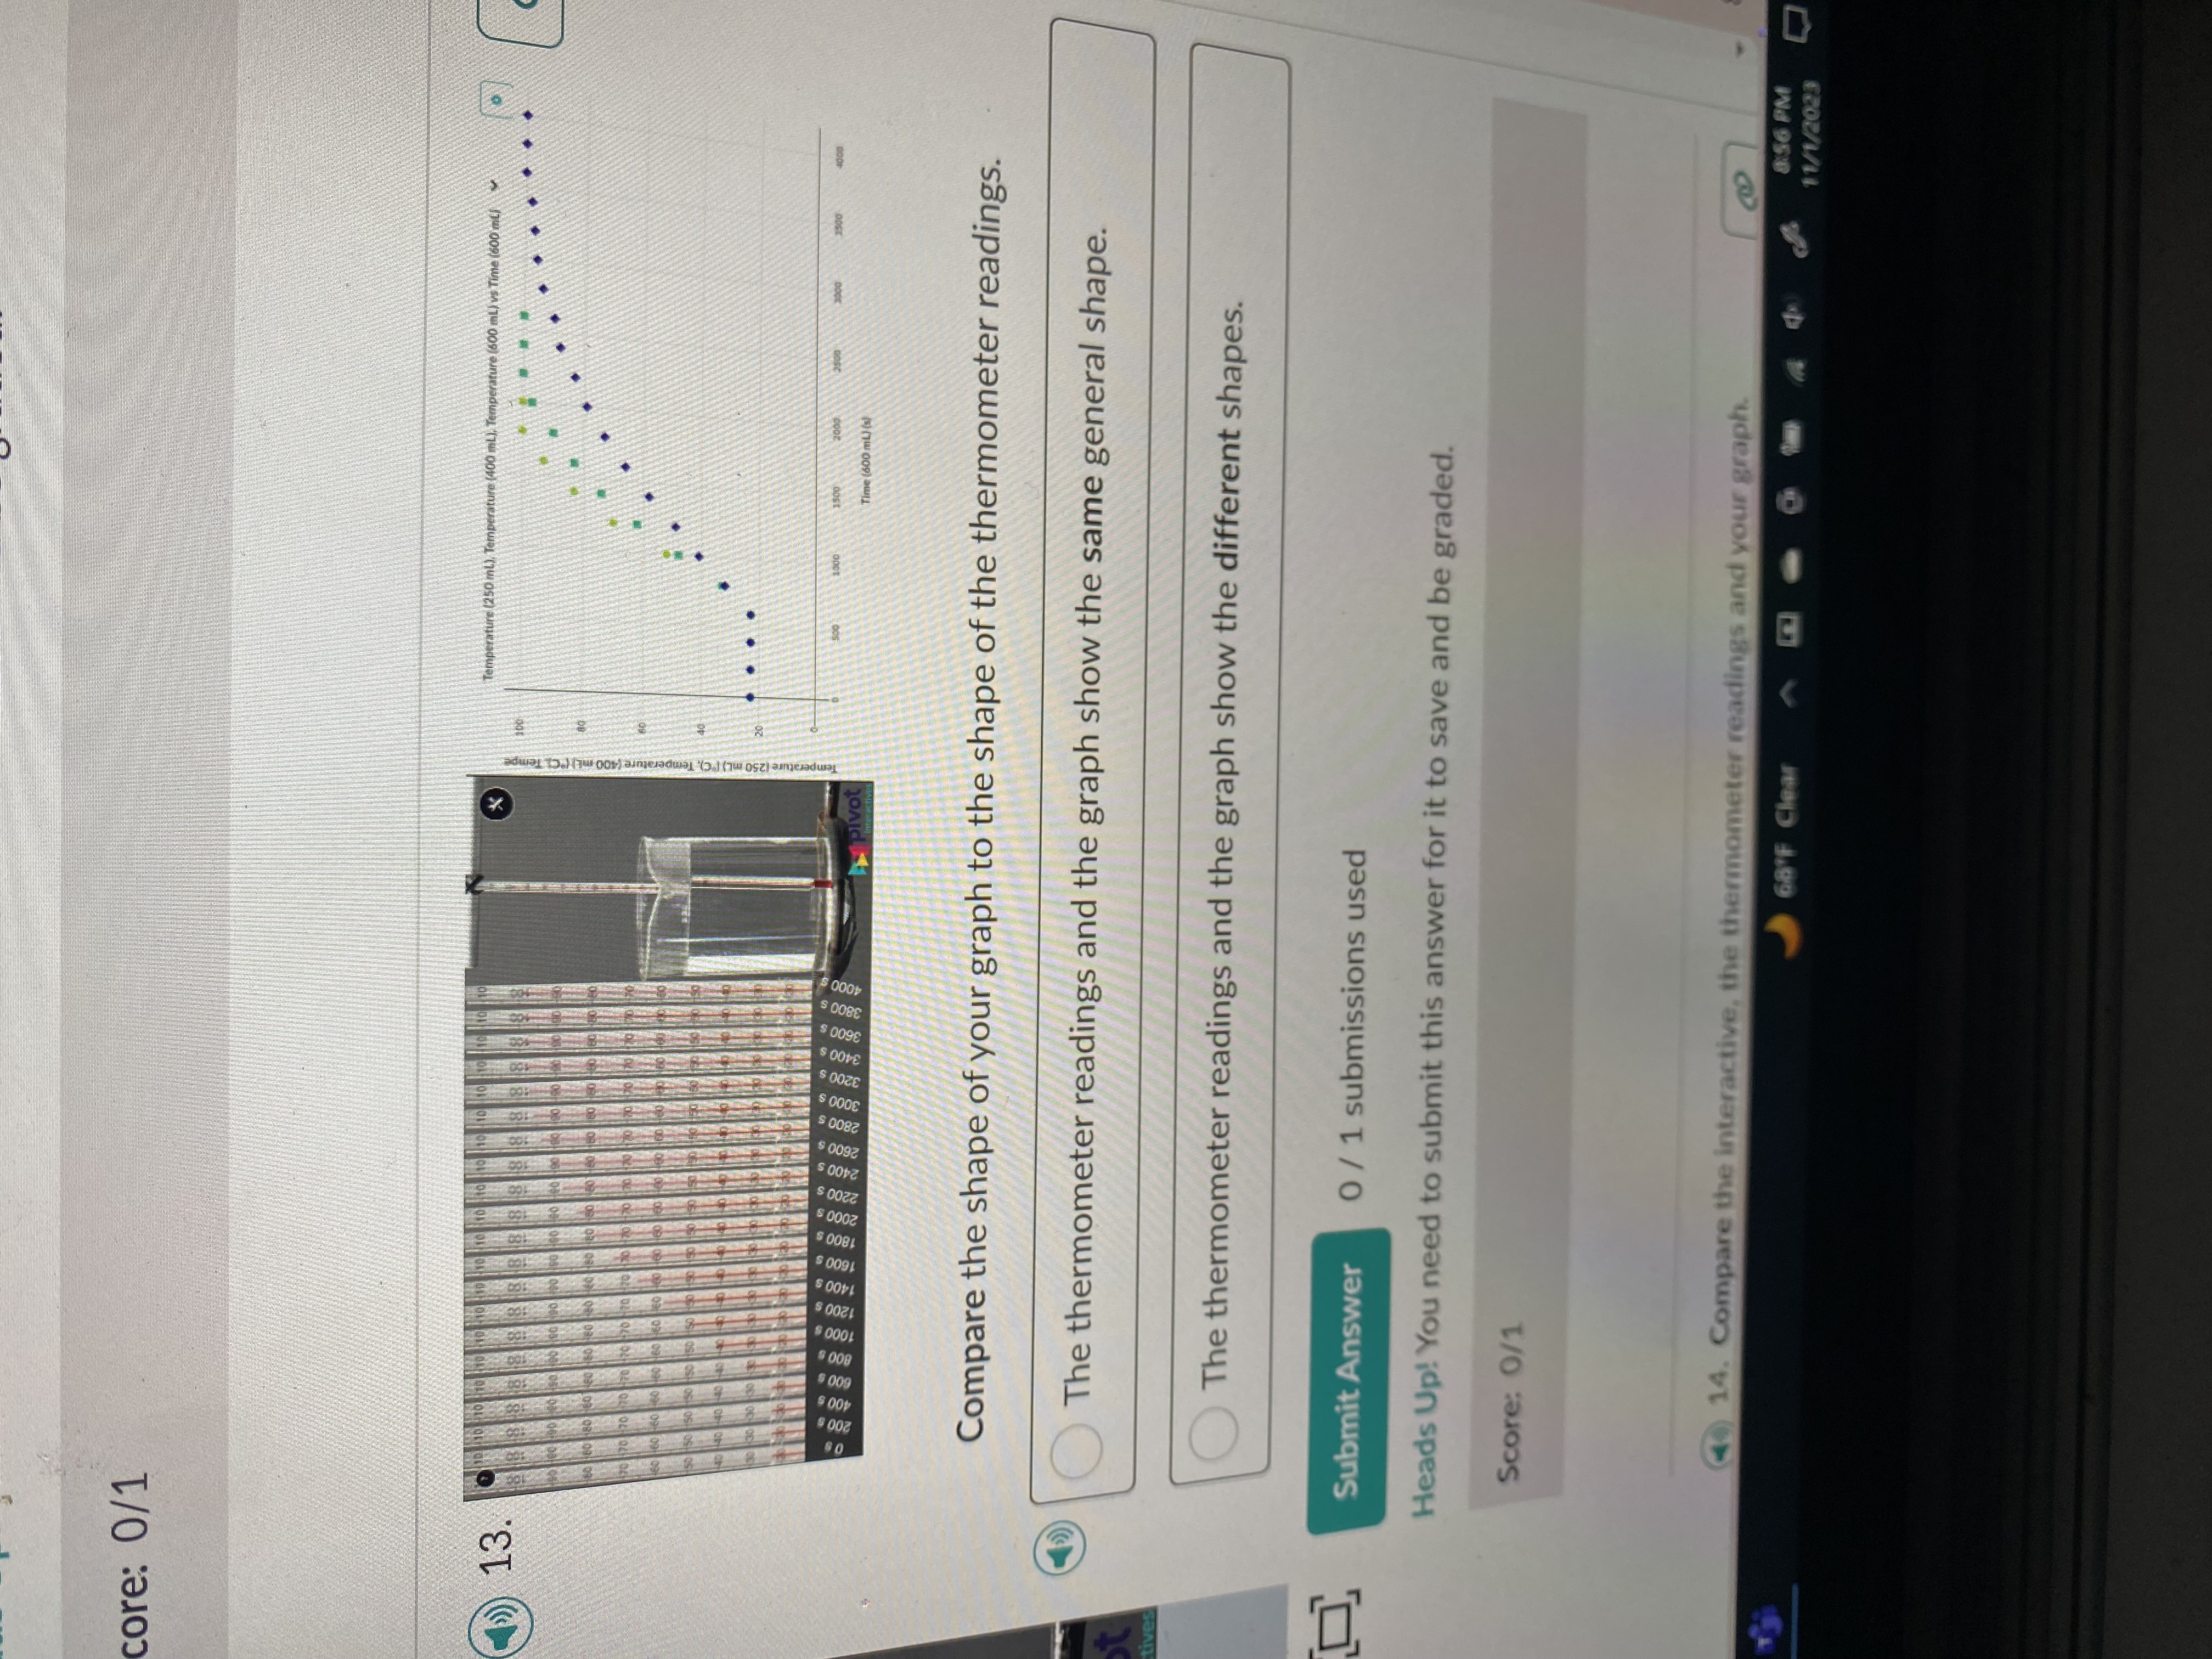
10 10 10 10 10 10 10 10 10 10 90 90 90 90 90 -90 90 90 90 go go go go 80 80 80 80 -80 80 80 80 80 80 80 80 80 70 70 70 70 70 60 60 60 60 50 50 50 50 40 40 30 30 9 8 8 8 9 200 s 8 600 s 800 s 1000 s 1600 s 1200 s 1400 s 1800 s 2000 s 2200 s 2400 s 2600 s Pivot VOLUME OF WATER #2-400 mL Change 14 Sco 10 2. Y Type here to search En10 10 10 10 10 10 10 10 10 10 10 10 10 10 10 10 10 10 100 8 8 8 8 8 8 8 8 8 8 8 8 8 8 8 8 8 8 8 90 90 90 90 90 90 90 90 90 90 90 90 90 90 90 90 90 90 90 90 90 80 80 80 80 80 80 80 80 80 80 80 80 80 80 80 80 80 80 80 80 180 70 70 70 70 70 70 70 70 70 20 70 70 70 70 70 70 70 20 70 60 60 60 60 60 60 60 60 60 60 60 60 60 60 60 60 60 60 60 60 50 50 50 50 50 50 50 50 50 50 40 40 40 40 50 150 150 40 30 30 30 30 30 8 888 1000 s 1200 s 1400 s 1600 s 1800 s 2000 s 2200 s 2400 s 2600 s 2800 s 3000 s 3200 s 3400 s 3600 s 3800 s 4000 s VOLUME OF WATER Pivot #3-600 mL Change SC 10 2. Type here to search ErSave & Close Submit for Grading 1. Observe the three different videos in this lab interactive. C What do you notice happening in the video? Describe and Identify at least 3 unique observations. B IUX X @ Vx PDF Score: 0/1 vot 2. You are assigned trial #3 for this part of the activity. Enter this trial # into the field below. 3 trial # Submit Answer 1 / submissions used Comments: That's right! You will collect data for Trial #3. 68F Clear 741 FM 11/1/2023Show Inline Question View Save & Close Submit for Grading 3. Fill in the data table below and construct a meaningful graph. 1. Select your video #3. 2. Select the tools icon on the top right. 1. Select the stopwatch from the top right. 3. Click play. 4. Click pause every 200 seconds. This corresponds to the picture of the thermometer as it is moved to the left side of the screen. 1. Measure the temperature (in degrees Celcius) and the corresponding passage of time. 2. Add those measurements to your data table. On your graph: 1. Click Configure Vertical Axis. Select the column that shows the temperature. ivot 2. Click Configure Horizontal Axis. Select the column that shows the time. Time ... Temperature ... S .C T 1 2 -> CD 68'F Clear 11/1/2023On your graph: 1. Click Configure Vertical Axis. Select the column that shows the temperature. 2. Click Configure Horizontal Axis. Select the column that shows the time. Time . .. Temperature t .C T 1 . .. 2 ... 3 ... + 4 ... 5 ... PIVOT interactive 7 ... 8 ... 9 ... 10 ... 11 ... 12 . .. 68.F Clear 7:41 PM 11/1/2023 PrtScn Home End PgUp PgDn Del F6 F7 F8 F9 F10 F11 F12 InsSave & Close Submit for Grading Graph 1 Title 10 8 6 Vertical Axis ivot interactive 21 8 10 Horizontal Axis Go Back to the Table T + Add Another Graph 7:42 PM T 68.F Clear 11/1/20234. Observe that the Bunsen burner does not turn on immediately. Identify the time when the Bunsen burner is ignited. seconds X Submit Answer 0 / 3 submissions used Heads Up! You need to submit this answer for it to save and be graded. Score: 0/1 + ) 5. Calculate the change in temperature from time 0 until the time the bunsen burner was turned on. .C Pivot 0 / co submissions used Heads Up! You need to submit this answer for it to save and be graded. Score: 0/1 ) 6. Describe the shape of the line on the graph from time 0 until the time the bunsen burner was turned on. A flat horizontal line 68OF Clear 7:42 PM 11/1/2023 PrtSon Home End F6 PgDn F7 F8 PgUp F9 De F10 F11 F12 InsScore: 0/1 6. Describe the shape of the line on the graph from time O until the time the bunsen burner was turned on. A flat horizontal line A line that goes up to the right. A line that goes down to the right. ivot A vertical line Submit Answer 0 / 3 submissions used Heads Up! You need to submit this answer for it to save and be graded. Score: 0/1 40 7. Compare your graph to your observation of temperature in the interactive video. 68.F Clear 7:42 PM 11/1/2023 PrtSon Home End PgUp PgDn FI F8 F9 F10 F11 F12 inSShow Inline Question View Save & Close Submit for Grading 4) 7. Compare your graph to your observation of temperature in the interactive video. Connect your graph to the observation of temperature in the interactive during the time before the Bunsen burner is turned on. There was no change in temperature in the water, so the graph shows a horizontal line to represent that change. Outlook There was no change in temperature in the water, so the graph shows a line going up to the right to represent that change. There was no change in temperature in the water, so the graph shows a line going + down to the right to represent that change. There was an increase in temperature in the water, so the graph shows a line Pivot going down to the right to represent that change. There was an increase in temperature in the water, so the graph shows a line going up to the right to represent that change. There was an increase in temperature in the water, so the graph shows a horizontal line to represent that change. Submit Answer 0 / 3 submissions used Heads Up! You need to submit this answer for it to save and be graded. Score. 0/1 68OF Clear 7:42 PM 11/1/2023 PrtSon Home End PgUp PqDn F6 F7 F8 F9 F10 F11 F12 AresSave & Close Submit for Grading 8. Describe what in the interactive indicates that the temperature is changing. The thermometers showed the same temperature at each time interval. The thermometers showed a different temperature at each time interval. The clock goes up in time The bunsen burner is lit Submit Answer 0 / 2 submissions used Heads Up! You need to submit this answer for it to save and be graded. Pivot Score: 0/1 4 9. Look again at your graph. Describe what in the graph indicates that the temperature is changing. Hint: Select all correct answers. A horizontal line 68.F Clear 7:43 PM 11/1/20239. Look again at your graph. Describe what in the graph indicates that the temperature is changing. Hint: Select all correct answers. A horizontal line A line going up to the right A line going down to the right Submit Answer 0 / 2 submissions used Heads Up! You need to submit this answer for it to save and be graded. Pivot Score: 0/1 10. Describe how you will know when the temperature stops changing. Select 2 correct responses. Select all that apply: CD 40 The temperature on the thermometers will not change from one time point to the next. 68*F Clear 7:43 PM 11/1/2023 PrtSon Home End PgUp PgDn De F6 F7 F8 F9 F10 F11 F12 Ins10. Describe how you will know when the temperature stops changing. Select 2 correct responses. Select all that apply: The temperature on the thermometers will not change from one time point to the next. The temperature on the thermometers will change from one time point to the next. The line on the graph will be horizontal The line on the graph will go up to the right. Pivot The line on the graph will go down to the right. Submit Answer 0 / 3 submissions used Heads Up! You need to submit this answer for it to save and be graded. Score: 0/1 4 11. You observed trial number 3. 68.F Clear 7:43 PM 11/1/2023 PrtSon Home End PgUp PgDn De F6. F7 F8 F9 F10 F11 F12 Ins11. You observed trial number 3. The bunsen burner was turned on at about 600 seconds. Calculate the amount of time that the temperature was changing after turning on the bunsen burner. seconds 0 / 3 submissions used Heads Up! You need to submit this answer for it to save and be graded. Score: 0/1 4>) 12. Identify the temperature at which the water no longer was changing. Pivot .C Submit Answer 0 / 3 submissions used Heads Up! You need to submit this answer for it to save and be graded. Score: 0/1 1 13. 68.F Clear 7:43 PM 11/1/2023 PrtSon Home End PgUp F7 PgDn Del F6 F8 F9 F10 F11 F12 Ins & 7 Backspace12. Identify the temperature at which the water no longer was changing. .C Submit Answer 0 / 3 submissions used Heads Up! You need to submit this answer for it to save and be graded. Score: 0/1 + 13. . Pivot interactive Compare the shape of your graph to the shape of the thermometer readings. The thermometer readings and the graph show the same general shape. The thermometer readings and the graph show the different shapes. Submit Answer 0 / 1 submissions used Heads Up! You need to submit this answer for it to save and be graded. 7:43 PM 68.F Clear 11/1/2023 Del PrtSon Home End PgUp PgDn F12 F7 F9 F10 F11 F6 Backspace 7 9 O 614. Compare the interactive, the thermometer readings and your graph. Describe what is similar between them during the times when the temperature is not changing. The line is horizontal. The line is vertical. The line is slanted upwards. The line is slanted downwards. The Bunsen burner is off. Pivot The water is boiling. Submit Answer 0 / 3 submissions used Heads Up! You need to submit this answer for it to save and be graded. Score: 0/1 CD 4 15. Describe what is different about the two time periods during which the 7:43 PM 68.F Clear 11/1/2023 PrtSon Home End PgUp PgDn Del F6 F7 F8 F9 F10 F11 F1215. Describe what is different about the two time periods during which the temperature is not changing. Select two descriptions. Select all that apply: They are at different heights on the graph. They are are at the same height on the graph. The bunsen burner is on in one time period and off during the other. Pivot The bunsen burner is on during both time periods The bunsen burner is off during both time periods Submit Answer 0 / 3 submissions used Heads Up! You need to submit this answer for it to save and be graded. Score: 0/1 68.F Clear 7:43 PM 11/1/2023 PrtSon Home End PgUp PgDn Del F6 F7 F8 F9 F10 F11 F12 Ins & Backspacecore: 0/1 Temperature (250 ml), Tempe 13 Temperature (250 mL) ["C), Temperature (400 mL) ("CI Tempe Time (600 ml) (s) Compare the shape of your graph to the shape of the thermometer readings. The thermometer readings and the graph show the same general shape. O The thermometer readings and the graph show the different shapes. Submit Answer 0 / 1 submissions used Heads Up! You need to submit this answer for it to save and be graded. Score: 0/1 4)14. Compare the interactive, the thermometer readings and your graph. GA'F Clear 8:56 PM 11/1/2023
Step by Step Solution
There are 3 Steps involved in it

Get step-by-step solutions from verified subject matter experts