

Question: College Enrollments Write a program to create the line chart in Fig. 6 . 1 8 . Use the data in Table 6 . 4
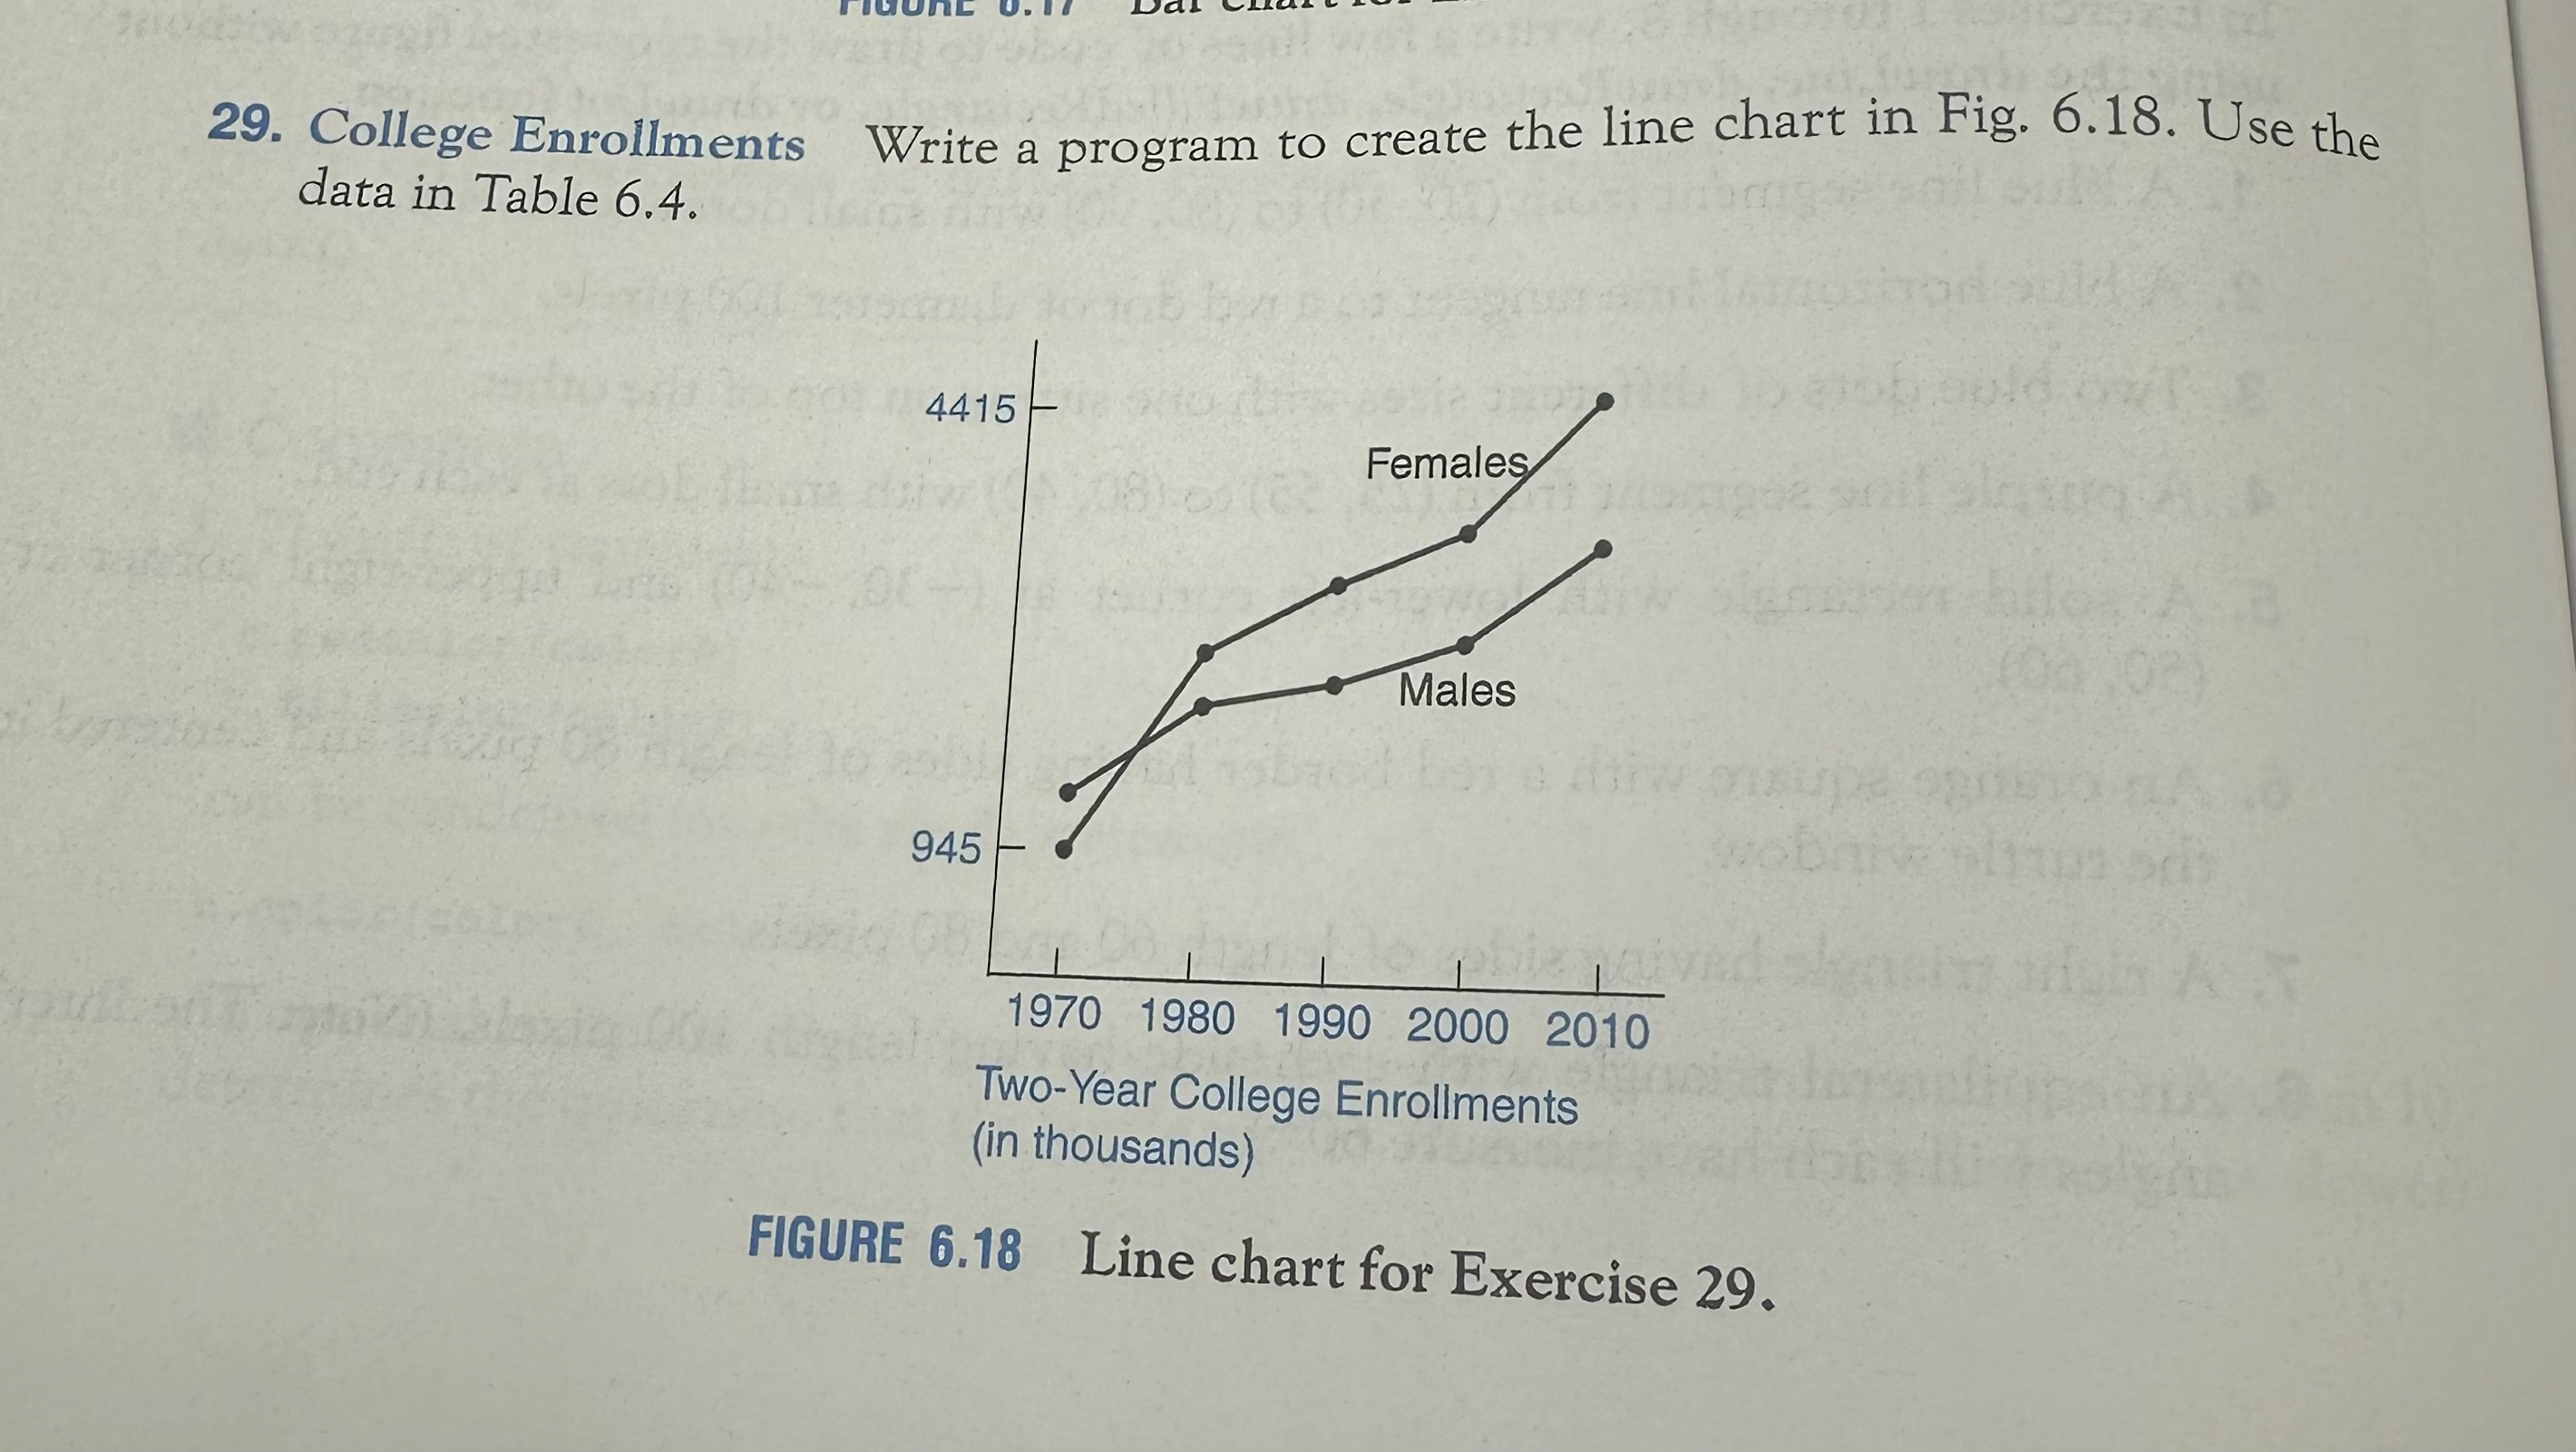
College Enrollments Write a program to create the line chart in Fig. Use the data in Table
TwoYear College Enrollments in thousands
FIGURE Line chart for Exercise
TABLE Twoyear college enrollments in thousands
Recursion
tableMaleFemale
College Enrollments Write a program to create the line chart in Fig. Use the data in Table
TwoYear College Enrollments in thousands
FIGURE Line chart for Exercise Python please
Step by Step Solution
There are 3 Steps involved in it
1 Expert Approved Answer
Step: 1 Unlock

Question Has Been Solved by an Expert!
Get step-by-step solutions from verified subject matter experts
Step: 2 Unlock
Step: 3 Unlock