

Question: collision, we repeated the same process with the soft collision. Attached below and to the right are the soft collision graphs. elocity X ((m/s))
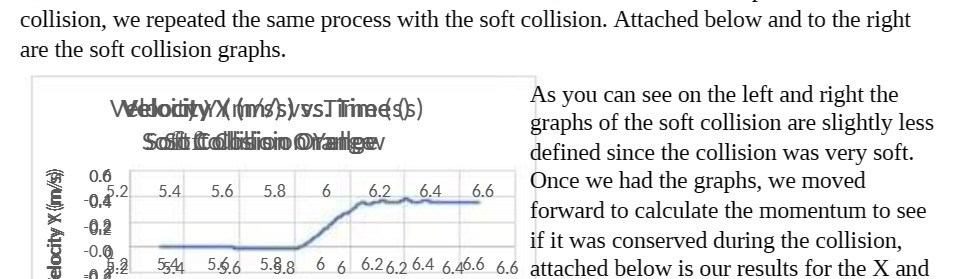
collision, we repeated the same process with the soft collision. Attached below and to the right are the soft collision graphs. elocity X ((m/s)) 0.6 -0.4 -0.2 WelodityX(ms) Times(s) Sofft folisiei OYatgev 5.2 5.4 5.6 5.8 6 6.2 6.4 6.6 -0.0 As you can see on the left and right the graphs of the soft collision are slightly less defined since the collision was very soft. Once we had the graphs, we moved forward to calculate the momentum to see if it was conserved during the collision, 5:2 5544 5.6 5.8.8 6 6 6.2 6.2 6.4 6.46.6 6.6 attached below is our results for the X and
Step by Step Solution
There are 3 Steps involved in it

Get step-by-step solutions from verified subject matter experts