Question: column chart in the range A27:344) by removing the data series labeled Total from the chart. (Hint: Do not filter out or hide the data.)
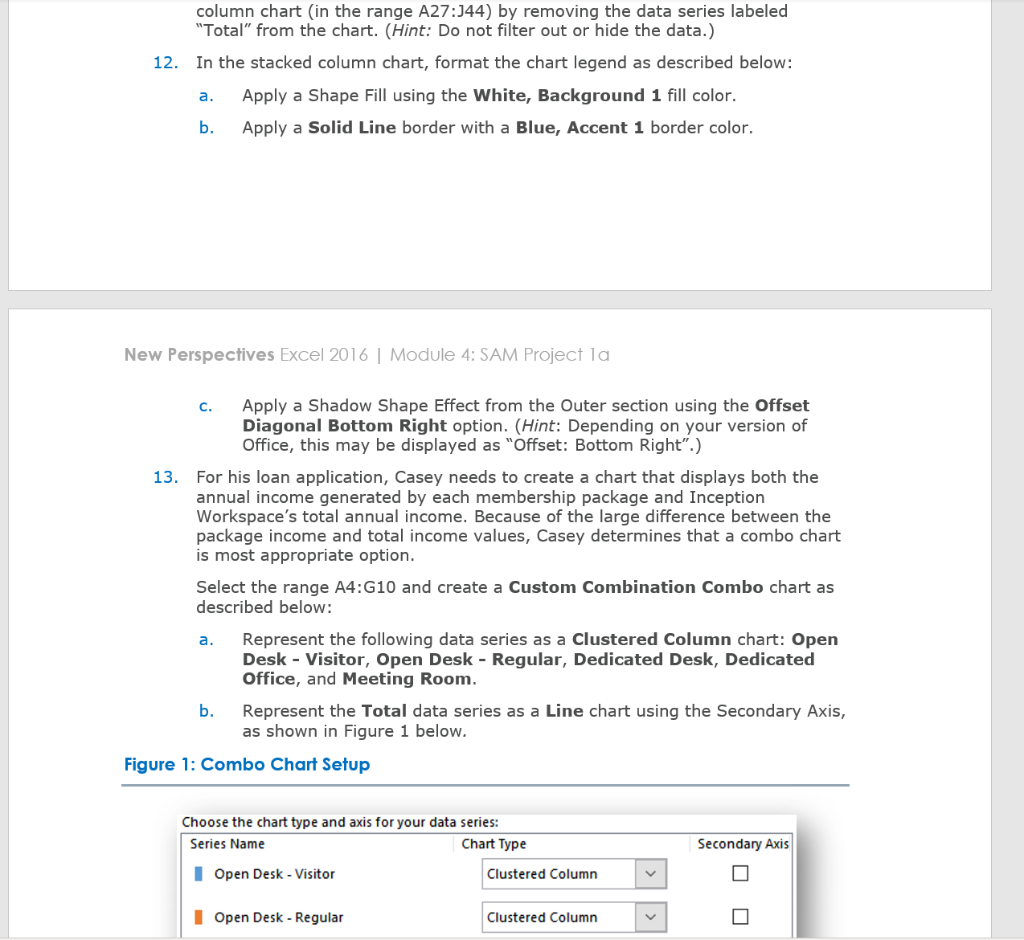
column chart in the range A27:344) by removing the data series labeled "Total" from the chart. (Hint: Do not filter out or hide the data.) 12. In the stacked column chart, format the chart legend as described below: a. Apply a Shape Fill using the White, Background 1 fill color. b. Apply a Solid Line border with a Blue, Accent 1 border color. New Perspectives Excel 2016 | Module 4: SAM Project la 13. c. Apply a Shadow Shape Effect from the Outer section using the Offset Diagonal Bottom Right option. (Hint: Depending on your version of Office, this may be displayed as "Offset: Bottom Right".) For his loan application, Casey needs to create a chart that displays both the annual income generated by each membership package and Inception Workspace's total annual income. Because of the large difference between the package income and total income values, Casey determines that a combo chart is most appropriate option. Select the range A4:G10 and create a Custom Combination Combo chart as described below: a. Represent the following data series as a Clustered Column chart: Open Desk - Visitor, Open Desk - Regular, Dedicated Desk, Dedicated Office, and Meeting Room. b. Represent the Total data series as a Line chart using the Secondary Axis, as shown in Figure 1 below. Figure 1: Combo Chart Setup Choose the chart type and axis for your data series: Series Name Chart Type Open Desk - Visitor Clustered Column Secondary Axis I Open Desk - Regular Clustered Column column chart in the range A27:344) by removing the data series labeled "Total" from the chart. (Hint: Do not filter out or hide the data.) 12. In the stacked column chart, format the chart legend as described below: a. Apply a Shape Fill using the White, Background 1 fill color. b. Apply a Solid Line border with a Blue, Accent 1 border color. New Perspectives Excel 2016 | Module 4: SAM Project la 13. c. Apply a Shadow Shape Effect from the Outer section using the Offset Diagonal Bottom Right option. (Hint: Depending on your version of Office, this may be displayed as "Offset: Bottom Right".) For his loan application, Casey needs to create a chart that displays both the annual income generated by each membership package and Inception Workspace's total annual income. Because of the large difference between the package income and total income values, Casey determines that a combo chart is most appropriate option. Select the range A4:G10 and create a Custom Combination Combo chart as described below: a. Represent the following data series as a Clustered Column chart: Open Desk - Visitor, Open Desk - Regular, Dedicated Desk, Dedicated Office, and Meeting Room. b. Represent the Total data series as a Line chart using the Secondary Axis, as shown in Figure 1 below. Figure 1: Combo Chart Setup Choose the chart type and axis for your data series: Series Name Chart Type Open Desk - Visitor Clustered Column Secondary Axis I Open Desk - Regular Clustered Column


