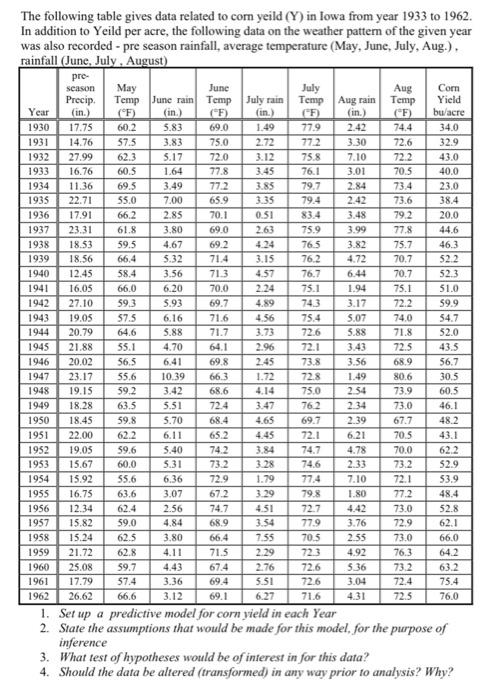
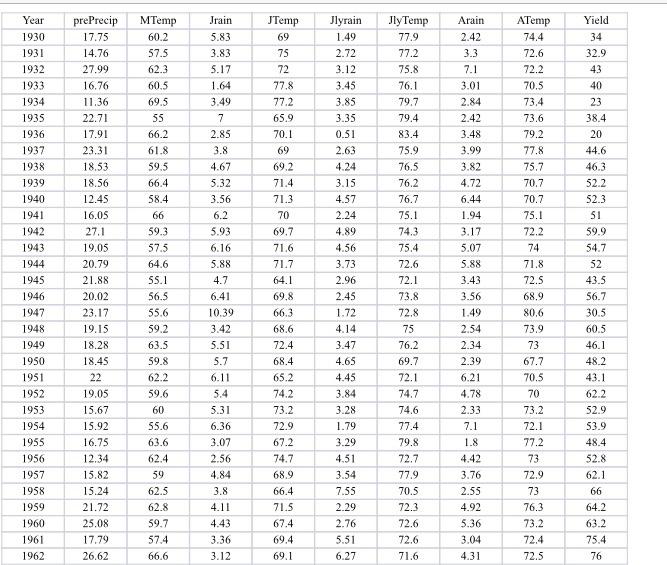
Question: Com Year (in.) 62.3 7.10 DID 66.4 The following table gives data related to com yeild (Y) in lowa from year 1933 to 1962. In

Com Year (in.) 62.3 7.10 DID 66.4 The following
Com Year (in.) 62.3 7.10 DID 66.4 The following table gives data related to com yeild (Y) in lowa from year 1933 to 1962. In addition to Yeild per acre, the following data on the weather pattern of the given year was also recorded - pre season rainfall, average temperature (May, June, July, Aug.). rainfall (June, July August) pre- season May June July Aug Precip, . Temp June rain Temp July rain Temp Aug rain Temp Yield (F) (in.) (F) (F) bu/acre 1930 17.75 60.2 5.83 69.0 1.49 779 2.42 74.4 34.0 1931 14.76 57.5 3.83 75.0 2.72 77.2 3.30 72.6 32.9 1932 27.99 5.17 72.0 3.12 75.8 72.2 43.0 1933 16.76 60.5 1.64 77.8 3.45 76.1 3.01 70.5 40.0 1934 11.36 69.5 3.49 77.2 3.85 79.7 2.84 73.4 23.0 1935 22.71 55.0 7.00 659 3.35 79.4 2.42 73.6 38.4 1936 17.91 66.2 2.85 70.1 0.51 83.4 3.48 79.2 20.0 1937 23.31 61.8 3.80 69.0 2.63 75.9 3.99 77.8 44.6 1938 18.53 59.5 4.67 69.2 76.5 3.82 75.7 46.3 1939 18.56 5.32 71.4 3.15 76.2 4.72 70.7 52.2 1940 12.45 58.4 3.56 71.3 4.57 76.7 6.44 70.7 52.3 1941 16.05 66.0 6.20 70.0 2.24 75.1 1.94 75.1 51.0 1942 27.10 59.3 5.93 69.7 4.89 743 3.17 72.2 59.9 1943 19.05 57.5 6.16 71.6 4.56 75.4 5.07 74.0 54.7 1944 20.79 64.6 5.88 71.7 3.73 72.6 5.88 71.8 52.0 1945 21.88 55.1 4.70 64.1 2.96 72.1 3.43 72.5 43.5 1946 20.02 56.5 6.41 69.8 2.45 73.8 3.56 68.9 56.7 1947 23.17 55.6 10.39 663 1.72 72.8 1.49 80.6 30.5 1948 19.15 3.42 68.6 4.14 75.0 2.54 73.9 1949 18.28 63.5 5.51 72.4 3.47 762 2.34 73.0 46.1 1950 18.45 59.8 5.70 68.4 4.65 69.7 2.39 67.7 48.2 1951 22.00 62.2 6.11 65.2 72.1 6.21 70.5 43.1 1952 19.05 59.6 5.40 74.2 3.84 74.7 4.78 700 62.2 1953 15.67 60.0 5.31 73.2 3.28 74.6 2.33 73.2 52.9 1954 15.92 55.6 6.36 729 1.79 77.4 7.10 72.1 53.9 1955 16.75 63.6 3.07 672 3.29 798 1.80 77.2 48.4 1956 12.34 62.4 2.56 74.7 4.51 72.7 4.42 73.0 52.8 1957 15.82 59.0 4.84 68.9 3.54 779 3.76 72.9 62.1 1958 15.24 62.5 3.80 66.4 7.55 70.5 2.55 73.0 66.0 1959 21.72 62.8 71.5 2.29 723 4.92 76.3 642 1960 25.08 59.7 67.4 2.76 72.6 5.36 73.2 63.2 1961 17.79 57.4 3.36 69.4 5.51 72.6 3.04 72.4 75.4 1962 26.62 66.6 3.12 69.1 6.27 716 4.31 72.5 76.0 1. Set up a predictive model for corn yield in each Year 2. State the assumptions that would be made for this model for the purpose of inference 3. What test of hypotheses would be of interest in for this data? 4. Should the data be altered (transformed in any way prior to analysis? Why? 592 60.5 LILI_________ TTTTTT NET Year 1930 1931 1932 1933 1934 1935 1936 1937 1938 1939 1940 1941 1942 1943 1944 1945 1946 1947 1948 1949 1950 1951 1952 1953 1954 1955 1956 1957 1958 1959 1960 1961 1962 pre Precip 17.75 14.76 27.99 16.76 11.36 22.71 17.91 23.31 18.53 18.56 12.45 16.05 27.1 19.05 20.79 21.88 20.02 23.17 19.15 18.28 18.45 22 19.05 15.67 15.92 16.75 12.34 15.82 15.24 21.72 25.08 17.79 26.62 MTemp 60.2 57.5 62.3 60.5 69.5 55 66.2 61.8 59.5 66.4 58.4 66 59.3 57.5 64.6 55.1 56.5 55.6 59.2 63.5 59.8 62.2 59.6 60 55.6 63.6 62.4 59 62.5 62.8 59.7 57.4 66.6 Jrain 5.83 3.83 5.17 1.64 3.49 7 2.85 3.8 4.67 5.32 3.56 6.2 5.93 6.16 5.88 4.7 6.41 10.39 3.42 5.51 5.7 6.11 5.4 5.31 6.36 3.07 2.56 4.84 3.8 4.11 4.43 3.36 3.12 JTemp 69 75 72 77.8 77.2 65.9 70.1 69 69.2 71.4 71.3 70 69.7 71.6 71.7 64.1 69,8 66.3 68.6 72.4 68.4 65.2 74.2 73.2 72.9 67.2 74.7 68.9 66.4 71.5 67.4 Jlyrain 1.49 2.72 3.12 3.45 3.85 3.35 0.51 2.63 4.24 3.15 4.57 2.24 4.89 4.56 3.73 2.96 2.45 1.72 4.14 3.47 4.65 4.45 3.84 3.28 1.79 3.29 4.51 3.54 7.55 2.29 2.76 5.51 6.27 JlyTemp 77.9 77.2 75.8 76.1 79.7 79.4 83.4 75.9 76.5 76.2 76.7 75.1 74.3 75.4 72.6 72.1 73.8 72.8 75 76.2 69.7 72.1 74.7 74.6 77.4 79.8 72.7 77.9 70.5 72.3 72.6 72.6 71.6 Arain 2.42 3.3 7.1 3.01 2.84 2.42 3.48 3.99 3.82 4.72 6.44 1.94 3.17 5.07 5.88 3.43 3.56 1.49 2.54 2.34 2.39 6.21 4.78 2.33 ATemp 74.4 72.6 72.2 70.5 73.4 73.6 79.2 77.8 75.7 70.7 70.7 75.1 72.2 74 71.8 72.5 68.9 80,6 73.9 73 67.7 70.5 70 73.2 72.1 77.2 73 72.9 73 76.3 73.2 72.4 72.5 Yield 34 32.9 43 40 23 38.4 20 44.6 46.3 52.2 52.3 51 59.9 54.7 52 43.5 56.7 30.5 60.5 46.1 48.2 43.1 62.2 52.9 53.9 48.4 52.8 62.1 66 64.2 63.2 75.4 76 7.1 1.8 4.42 3.76 2.55 4.92 5.36 3.04 4.31 69.4 69.1 Com Year (in.) 62.3 7.10 DID 66.4 The following table gives data related to com yeild (Y) in lowa from year 1933 to 1962. In addition to Yeild per acre, the following data on the weather pattern of the given year was also recorded - pre season rainfall, average temperature (May, June, July, Aug.). rainfall (June, July August) pre- season May June July Aug Precip, . Temp June rain Temp July rain Temp Aug rain Temp Yield (F) (in.) (F) (F) bu/acre 1930 17.75 60.2 5.83 69.0 1.49 779 2.42 74.4 34.0 1931 14.76 57.5 3.83 75.0 2.72 77.2 3.30 72.6 32.9 1932 27.99 5.17 72.0 3.12 75.8 72.2 43.0 1933 16.76 60.5 1.64 77.8 3.45 76.1 3.01 70.5 40.0 1934 11.36 69.5 3.49 77.2 3.85 79.7 2.84 73.4 23.0 1935 22.71 55.0 7.00 659 3.35 79.4 2.42 73.6 38.4 1936 17.91 66.2 2.85 70.1 0.51 83.4 3.48 79.2 20.0 1937 23.31 61.8 3.80 69.0 2.63 75.9 3.99 77.8 44.6 1938 18.53 59.5 4.67 69.2 76.5 3.82 75.7 46.3 1939 18.56 5.32 71.4 3.15 76.2 4.72 70.7 52.2 1940 12.45 58.4 3.56 71.3 4.57 76.7 6.44 70.7 52.3 1941 16.05 66.0 6.20 70.0 2.24 75.1 1.94 75.1 51.0 1942 27.10 59.3 5.93 69.7 4.89 743 3.17 72.2 59.9 1943 19.05 57.5 6.16 71.6 4.56 75.4 5.07 74.0 54.7 1944 20.79 64.6 5.88 71.7 3.73 72.6 5.88 71.8 52.0 1945 21.88 55.1 4.70 64.1 2.96 72.1 3.43 72.5 43.5 1946 20.02 56.5 6.41 69.8 2.45 73.8 3.56 68.9 56.7 1947 23.17 55.6 10.39 663 1.72 72.8 1.49 80.6 30.5 1948 19.15 3.42 68.6 4.14 75.0 2.54 73.9 1949 18.28 63.5 5.51 72.4 3.47 762 2.34 73.0 46.1 1950 18.45 59.8 5.70 68.4 4.65 69.7 2.39 67.7 48.2 1951 22.00 62.2 6.11 65.2 72.1 6.21 70.5 43.1 1952 19.05 59.6 5.40 74.2 3.84 74.7 4.78 700 62.2 1953 15.67 60.0 5.31 73.2 3.28 74.6 2.33 73.2 52.9 1954 15.92 55.6 6.36 729 1.79 77.4 7.10 72.1 53.9 1955 16.75 63.6 3.07 672 3.29 798 1.80 77.2 48.4 1956 12.34 62.4 2.56 74.7 4.51 72.7 4.42 73.0 52.8 1957 15.82 59.0 4.84 68.9 3.54 779 3.76 72.9 62.1 1958 15.24 62.5 3.80 66.4 7.55 70.5 2.55 73.0 66.0 1959 21.72 62.8 71.5 2.29 723 4.92 76.3 642 1960 25.08 59.7 67.4 2.76 72.6 5.36 73.2 63.2 1961 17.79 57.4 3.36 69.4 5.51 72.6 3.04 72.4 75.4 1962 26.62 66.6 3.12 69.1 6.27 716 4.31 72.5 76.0 1. Set up a predictive model for corn yield in each Year 2. State the assumptions that would be made for this model for the purpose of inference 3. What test of hypotheses would be of interest in for this data? 4. Should the data be altered (transformed in any way prior to analysis? Why? 592 60.5 LILI_________ TTTTTT NET Year 1930 1931 1932 1933 1934 1935 1936 1937 1938 1939 1940 1941 1942 1943 1944 1945 1946 1947 1948 1949 1950 1951 1952 1953 1954 1955 1956 1957 1958 1959 1960 1961 1962 pre Precip 17.75 14.76 27.99 16.76 11.36 22.71 17.91 23.31 18.53 18.56 12.45 16.05 27.1 19.05 20.79 21.88 20.02 23.17 19.15 18.28 18.45 22 19.05 15.67 15.92 16.75 12.34 15.82 15.24 21.72 25.08 17.79 26.62 MTemp 60.2 57.5 62.3 60.5 69.5 55 66.2 61.8 59.5 66.4 58.4 66 59.3 57.5 64.6 55.1 56.5 55.6 59.2 63.5 59.8 62.2 59.6 60 55.6 63.6 62.4 59 62.5 62.8 59.7 57.4 66.6 Jrain 5.83 3.83 5.17 1.64 3.49 7 2.85 3.8 4.67 5.32 3.56 6.2 5.93 6.16 5.88 4.7 6.41 10.39 3.42 5.51 5.7 6.11 5.4 5.31 6.36 3.07 2.56 4.84 3.8 4.11 4.43 3.36 3.12 JTemp 69 75 72 77.8 77.2 65.9 70.1 69 69.2 71.4 71.3 70 69.7 71.6 71.7 64.1 69,8 66.3 68.6 72.4 68.4 65.2 74.2 73.2 72.9 67.2 74.7 68.9 66.4 71.5 67.4 Jlyrain 1.49 2.72 3.12 3.45 3.85 3.35 0.51 2.63 4.24 3.15 4.57 2.24 4.89 4.56 3.73 2.96 2.45 1.72 4.14 3.47 4.65 4.45 3.84 3.28 1.79 3.29 4.51 3.54 7.55 2.29 2.76 5.51 6.27 JlyTemp 77.9 77.2 75.8 76.1 79.7 79.4 83.4 75.9 76.5 76.2 76.7 75.1 74.3 75.4 72.6 72.1 73.8 72.8 75 76.2 69.7 72.1 74.7 74.6 77.4 79.8 72.7 77.9 70.5 72.3 72.6 72.6 71.6 Arain 2.42 3.3 7.1 3.01 2.84 2.42 3.48 3.99 3.82 4.72 6.44 1.94 3.17 5.07 5.88 3.43 3.56 1.49 2.54 2.34 2.39 6.21 4.78 2.33 ATemp 74.4 72.6 72.2 70.5 73.4 73.6 79.2 77.8 75.7 70.7 70.7 75.1 72.2 74 71.8 72.5 68.9 80,6 73.9 73 67.7 70.5 70 73.2 72.1 77.2 73 72.9 73 76.3 73.2 72.4 72.5 Yield 34 32.9 43 40 23 38.4 20 44.6 46.3 52.2 52.3 51 59.9 54.7 52 43.5 56.7 30.5 60.5 46.1 48.2 43.1 62.2 52.9 53.9 48.4 52.8 62.1 66 64.2 63.2 75.4 76 7.1 1.8 4.42 3.76 2.55 4.92 5.36 3.04 4.31 69.4 69.1

Step by Step Solution

There are 3 Steps involved in it

1 Expert Approved Answer
Step: 1 Unlock blur-text-image
Question Has Been Solved by an Expert!

Get step-by-step solutions from verified subject matter experts

Step: 2 Unlock
Step: 3 Unlock

Students Have Also Explored These Related General Management Questions!