

Question: come up with a final model for this dataset. CRIM ZN INDUS CHAS NOX RM AGE DIS RAD TAX PTRATIO B LSTAT MEDV 0.00632 18
come up with a final model for this dataset.
| CRIM | ZN | INDUS | CHAS | NOX | RM | AGE | DIS | RAD | TAX | PTRATIO | B | LSTAT | MEDV |
| 0.00632 | 18 | 2.31 | 0 | 0.538 | 6.575 | 65.2 | 4.09 | 1 | 296 | 15.3 | 396.9 | 4.98 | 24 |
| 0.02731 | 0 | 7.07 | 0 | 0.469 | 6.421 | 78.9 | 4.9671 | 2 | 242 | 17.8 | 396.9 | 9.14 | 21.6 |
| 0.02729 | 0 | 7.07 | 0 | 0.469 | 7.185 | 61.1 | 4.9671 | 2 | 242 | 17.8 | 392.83 | 4.03 | 34.7 |
| 0.03237 | 0 | 2.18 | 0 | 0.458 | 6.998 | 45.8 | 6.0622 | 3 | 222 | 18.7 | 394.63 | 2.94 | 33.4 |
| 0.06905 | 0 | 2.18 | 0 | 0.458 | 7.147 | 54.2 | 6.0622 | 3 | 222 | 18.7 | 396.9 | 5.33 | 36.2 |
| 0.02985 | 0 | 2.18 | 0 | 0.458 | 6.43 | 58.7 | 6.0622 | 3 | 222 | 18.7 | 394.12 | 5.21 | 28.7 |
| 0.08829 | 12.5 | 7.87 | 0 | 0.524 | 6.012 | 66.6 | 5.5605 | 5 | 311 | 15.2 | 395.6 | 12.43 | 22.9 |
| 0.14455 | 12.5 | 7.87 | 0 | 0.524 | 6.172 | 96.1 | 5.9505 | 5 | 311 | 15.2 | 396.9 | 19.15 | 27.1 |
| 0.21124 | 12.5 | 7.87 | 0 | 0.524 | 5.631 | 100 | 6.0821 | 5 | 311 | 15.2 | 386.63 | 29.93 | 16.5 |
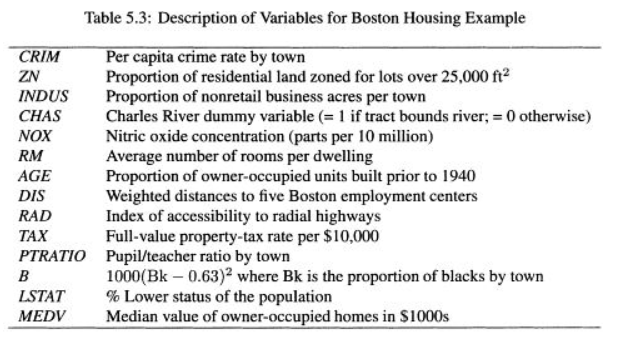
Table 5.3: Description of Variables for Boston Housing Example CRIM ZN INDUS CHAS NOX RM AGE DIS RAD TAX Per capita crime rate by town Proportion of residential land zoned for lots over 25,000 ft2 Proportion of nonretail business acres per town Charles River dummy variable (= 1 if tract bounds river; = 0 otherwise) Nitric oxide concentration (parts per 10 million) Average number of rooms per dwelling Proportion of owner-occupied units built prior to 1940 Weighted distances to five Boston employment centers Index of accessibility to radial highways Full-value property-tax rate per $10,000 Pupil/teacher ratio by town 1000(Bk -0.63)2 where Bk is the proportion of blacks by town % Lower status of the population Median value of owner-occupied homes in $1000s LSTAT MEDV Table 5.3: Description of Variables for Boston Housing Example CRIM ZN INDUS CHAS NOX RM AGE DIS RAD TAX Per capita crime rate by town Proportion of residential land zoned for lots over 25,000 ft2 Proportion of nonretail business acres per town Charles River dummy variable (= 1 if tract bounds river; = 0 otherwise) Nitric oxide concentration (parts per 10 million) Average number of rooms per dwelling Proportion of owner-occupied units built prior to 1940 Weighted distances to five Boston employment centers Index of accessibility to radial highways Full-value property-tax rate per $10,000 Pupil/teacher ratio by town 1000(Bk -0.63)2 where Bk is the proportion of blacks by town % Lower status of the population Median value of owner-occupied homes in $1000s LSTAT MEDV
Step by Step Solution
There are 3 Steps involved in it

Get step-by-step solutions from verified subject matter experts