

Question: Comment on at least three points, interpreting the data into management information. and Find corporate policies or practices information on company that might explain one
Comment on at least three points, interpreting the data into management information. and Find corporate policies or practices information on company that might explain one of the trends or variances. This information can be found in financial news, company press releases, or the MD&A (management discussion and analysis), in the annual reports
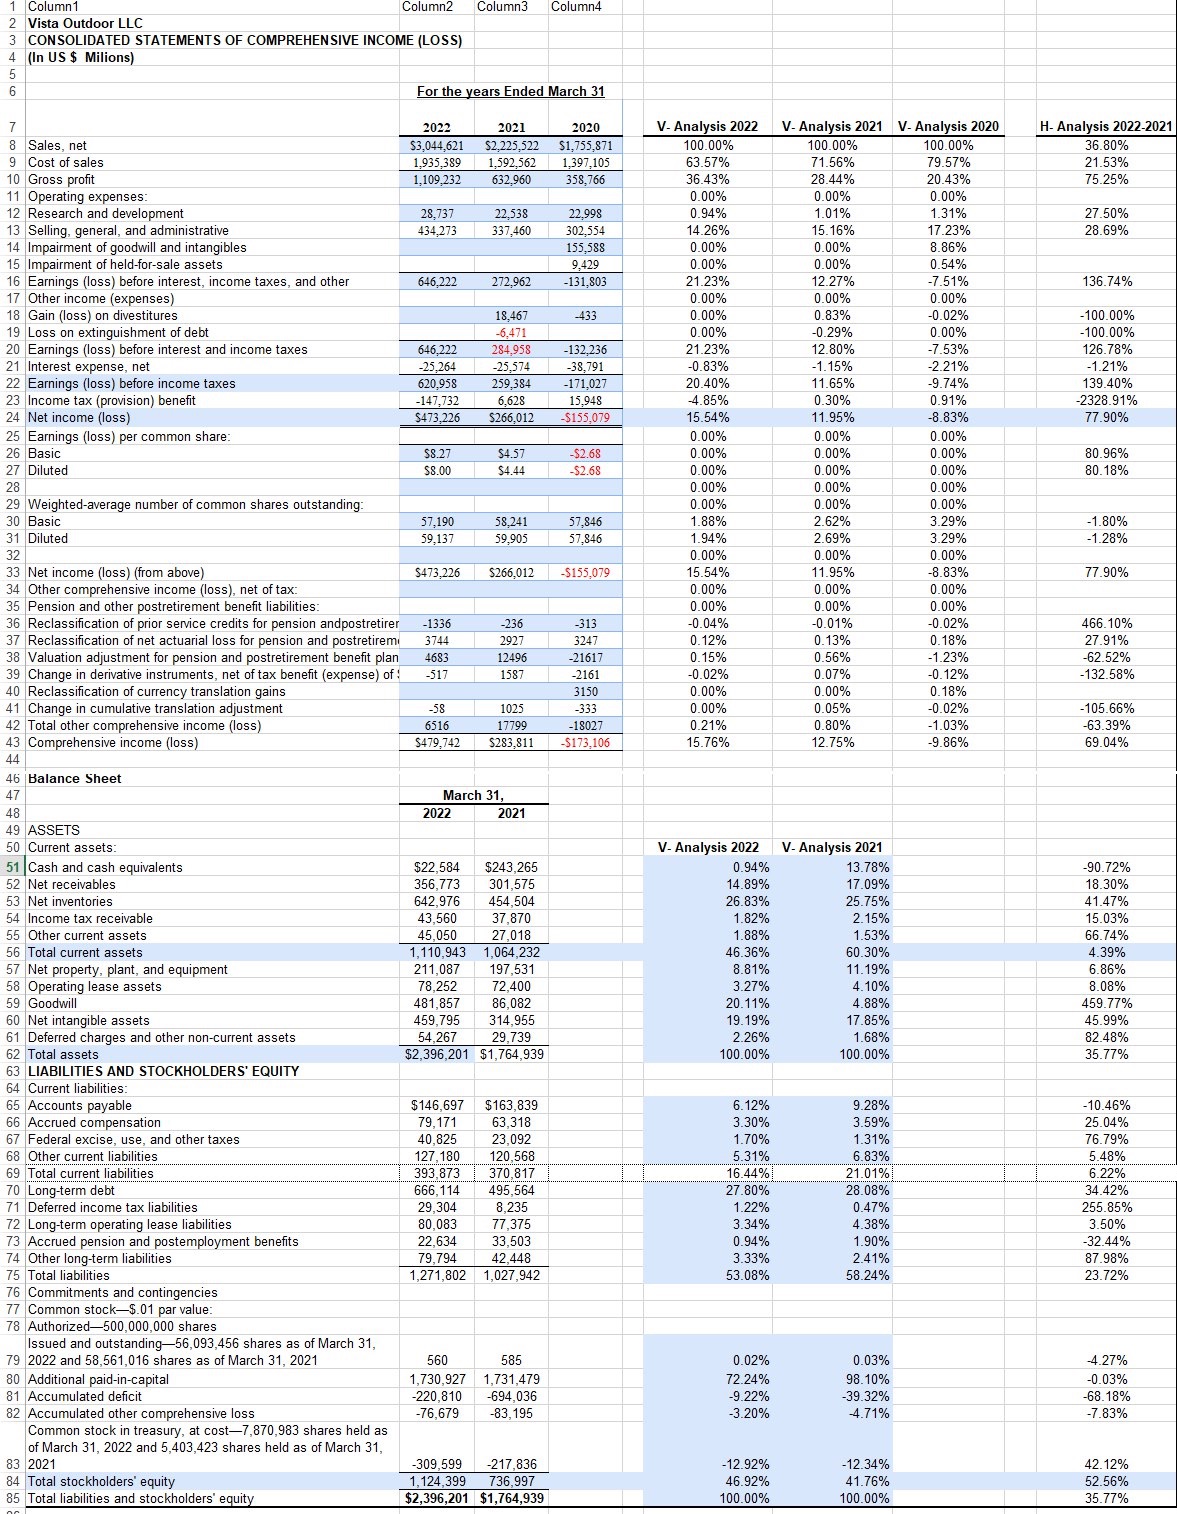
Column 1 Column2 Column3 Column4 Vista Outdoor LLC 3 CONSOLIDATED STATEMENTS OF COMPREHENSIVE INCOME (LOSS) (In US $ Milions) For the years Ended March 31 7 2022 2021 2020 V- Analysis 2022 V- Analysis 2021 V- Analysis 2020 H- Analysis 2022-202 8 Sales, net $3,044,621 $2,225,522 $1,755,871 100.00% 00.00% 00.00% 36.80% 9 Cost of sales 1,935,389 1,592,562 1,397,105 63.57% '1.569 9.57% 21.53% 10 Gross profit 1,109,232 632,960 358,766 36.43% 28.44% 20.43 75.25% 0.00% 11 Operating expenses: 0.00% 0.00% 2 Research and development 28,737 12,538 22,998 0.94% 1.01% 1.31% 27.50% 13 Selling, general, and administrative 434,273 337,46 302,554 4.26% 15.16% 17.23% 28.69% 14 Impairment of goodwill and intangibles 55,585 1.00% 0.00% 8.86% 15 Impairment of held-for-sale assets 9,429 0.00% 0.00% 0.54% 16 Earnings (loss) before interest, income taxes, and other 646.222 272,962 -131,803 21.23% 2.27% -7.51% 136.74% 17 Other income (expenses) 0.00% 0.00% 0.00% 18 Gain (loss) on divestitures 18,467 -433 0.00% 0.83% -0.02% -100.00% 19 Loss on extinguishment of debt 6.471 0.00% 0.29% ).00% 100.00% 20 Earnings (loss) before interest and income taxes 646,222 284,958 -132,236 21.23% 12.80% 7.53% 26.78% 21 Interest expense, net -25.264 -25.574 -38.791 -0.83% -1.15% 2.21% 1.21% 22 Earnings (loss) before income taxes 620,958 259,38 71,02 20.40% 11.65% 3.74% 139.40% 23 Income tax (provision) benefit -147,732 6,628 15,948 4.85% 0.30% 0.91% -2328.91% 24 Net income (loss $473.226 $266,012 $155,079 15.54% 11.959 -8.83% 77.90% 25 Earnings (loss) per common share: 0.00% 0.00% 0.00% 26 Basic $8.27 $4.57 -$2.68 0.00% 0.00% 0.00% 80.96% 27 Diluted $8.00 $4.44 $2.68 0.00% 0.00% 0.00% 80.18% 28 0.00% 0.00% 0.00% 29 Weighted-average number of common shares outstanding 0.00% 0.00% 0.00% 30 Basic 7,190 58,241 17,846 1.88% 2.62% 29% -1.80% 31 Diluted 9.137 59.905 57.846 1.94% 2.69% 3.29% 1.28% 32 0.00% 0.00% 0.00% 33 Net income (loss) (from above) $473,226 $266,012 -$155,079 5.54% 11.95% -8.83% 77.90% 34 Other comprehensive income (loss), net of tax: 0.00% 0.00% 0.00% 5 Pension and other postretirement benefit liabilities: 0.00% 0.00% 0.00% 36 Reclassification of prior service credits for pension andpostretirer -1336 -236 -313 -0.04% -0.01% -0.02% 466.10% 37 Reclassification of net actuarial loss for pension and postretirem 3744 2927 3247 0.12% 0.13% 0. 18% 27.91% 38 Valuation adjustment for pension and postretirement benefit plan 4683 1249 21617 0. 15% 0.56% 1.23% -62.52% 39 Change in derivative instruments, net of tax benefit (expense) of 517 1587 -2161 -0.02% 0.07% 0. 12% -132.58% 40 Reclassification of currency translation gains 3150 0.00% 0.00% 0. 18% 41 Change in cumulative translation adjustment -58 1025 -333 0.00% 0.05% -0.02% 105.66% 42 Total other comprehensive income (loss) 6516 17799 -18027 0.21% 0.80% -1.03% -63.39% 43 Comprehensive income (loss) $479,742 $283,811 -$173,106 15.76% 12.75% -9.86% 69.04% 44 46 Balance Sheet 47 March 31, 48 2022 2021 49 ASSETS 50 Current assets: V- Analysis 2022 V- Analysis 2021 51 Cash and cash equivalents $22,584 $243,265 0.94% 13.78% -90.72% 52 Net receivables 356,773 301,575 14.89% 17.09% 18.30% 53 Net inventories 642,976 454,504 6.83% 25.75% 41.47% 54 Income tax receivable 43.560 37,870 1.82% 2. 15% 15.03% 55 Other current assets 45,050 27,018 1.88% 1.53% $6.74% 56 Total current assets 1, 110,943 1,064,232 16.36% 60.30% 4.39% 57 Net property, plant, and equipment 211,087 197,531 B.81% 11.19% 6.86% 58 Operating lease assets 78,252 72,400 3.27% 4.10% 8.08% 59 Goodwill 481,857 86.082 20.11% 4.88% 459.77% 60 Net intangible assets 459,795 314,955 19 19% 17.85% 45.99% 61 Deferred charges and other non-current assets 54,267 29,739 2.26% 1.68% 82.48% 62 Total assets $2,396,201 $1,764,939 100.00% 100.00% 35.77% 63 LIABILITIES AND STOCKHOLDERS' EQUITY 64 Current liabilities: 65 Accounts payable $146,697 $163,839 6.12% 9.28% 10.46% 66 Accrued compensation 79, 171 63,318 3.30% 3.59% 25.04% 67 Federal excise, use, and other taxes 0,825 23,092 1.70% 1.31% 76.79% 68 Other current liabilities 127, 180 120,568 5 31% 6.83% 5.48% 69 Total current liabilities 393, 873 "370,817" 16.44% 21 01% 6.22% 70 Long-term debt 66, 114 495,564 7.80% 28.08% 34.42% 71 Deferred income tax liabilities 29,304 8,235 .22% 0.47% 255.85% 72 Long-term operating lease liabilities 80,083 77,375 3.34% 4.38% 3.50% 73 Accrued pension and postemployment benefits 22,634 33,503 0.94% 1.90% -32.44% 74 Other long-term liabilities 79,794 42,448 3.33% 2 41% 87.98% 75 Total liabilities 1,271,802 1,027,942 53.08% 58.24% 23.72% 76 Commitments and contingencies 77 Common stock-$.01 par value 78 Authorized-500,000,000 shares Issued and outstanding-56,093,456 shares as of March 31, 79 2022 and 58,561,016 shares as of March 31, 2021 560 585 0.02% 0.03% -4.27% 80 Additional paid-in-capital 1,730,927 1,731,479 72.24% 98.10% -0.03% 81 Accumulated deficit 220,810 694,036 -9.22% 39.32% 68. 18% 82 Accumulated other comprehensive loss -76,679 -83, 19 3.20% -4.71% 7.83% Common stock in treasury, at cost-7,870,983 shares held as of March 31, 2022 and 5,403,423 shares held as of March 31, 63 2021 -309,599 -217,836 -12.92% -12.34% 42.12% 84 Total stockholders' equity 1, 124,399 736,997 46.92% 41.76% 52.56% 5 Total liabilities and stockholders' equity $2,396,201 $1,764,939 100.00% 00.00% 5.77%
Step by Step Solution
There are 3 Steps involved in it

Get step-by-step solutions from verified subject matter experts