

Question: Comment on the descriptive statistics (i.e. minimum, maximum, mean, median, standard deviation, First quartile, and third quartile, skewness and kurtosis coefficients) of (i) Stock prices

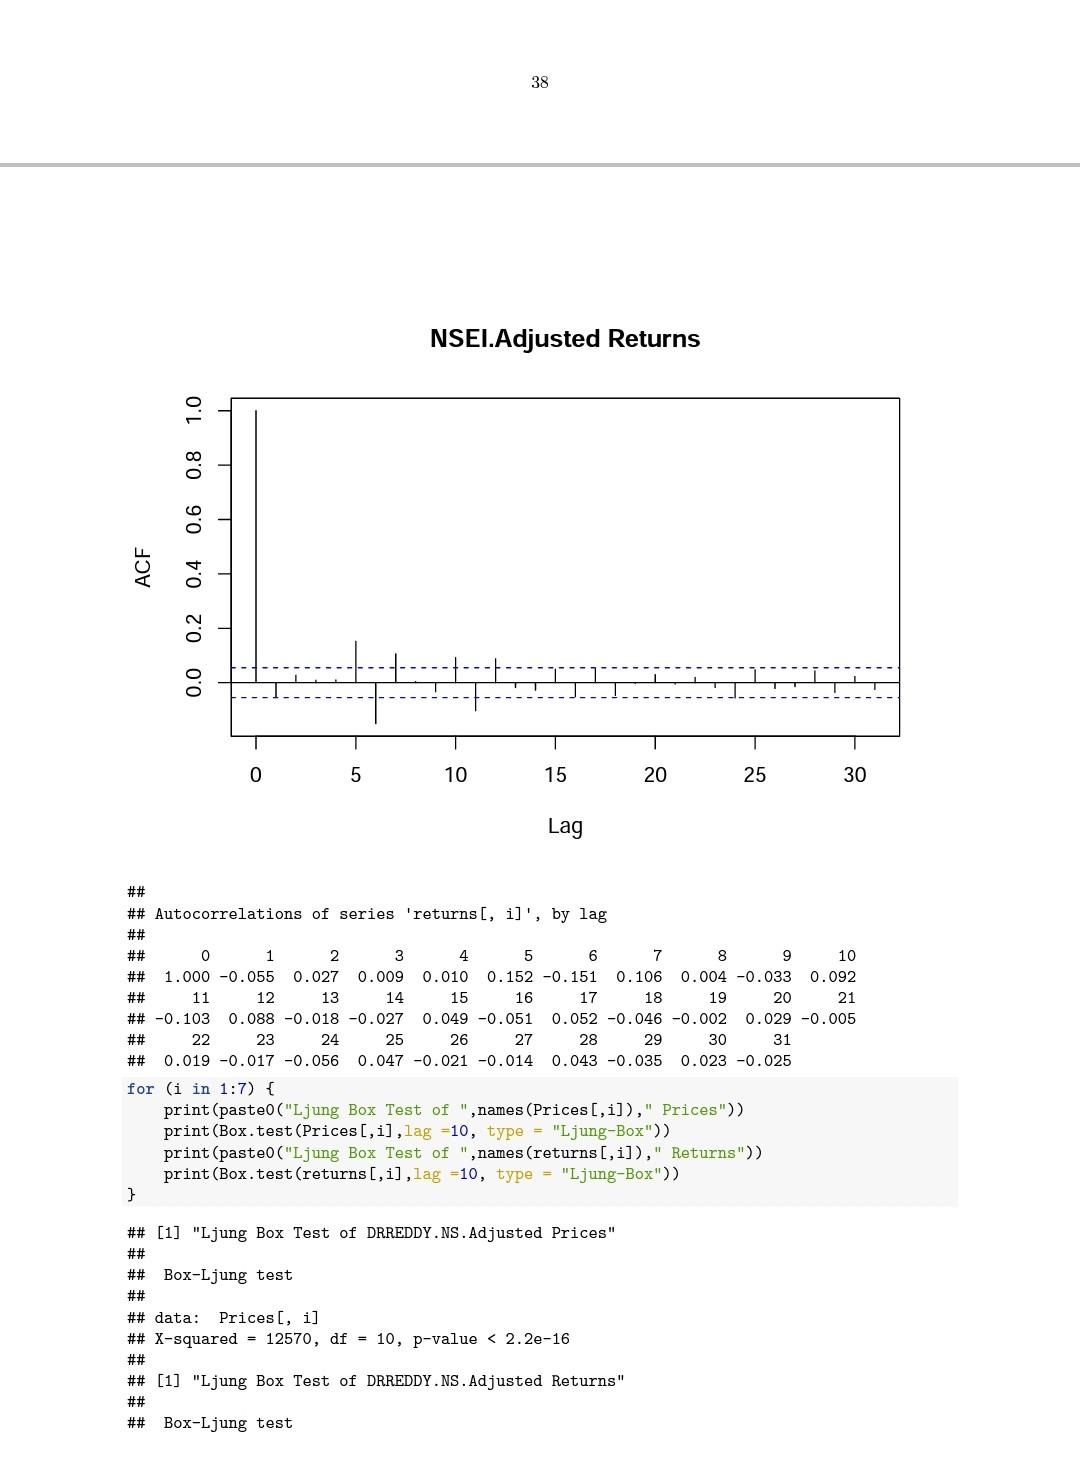
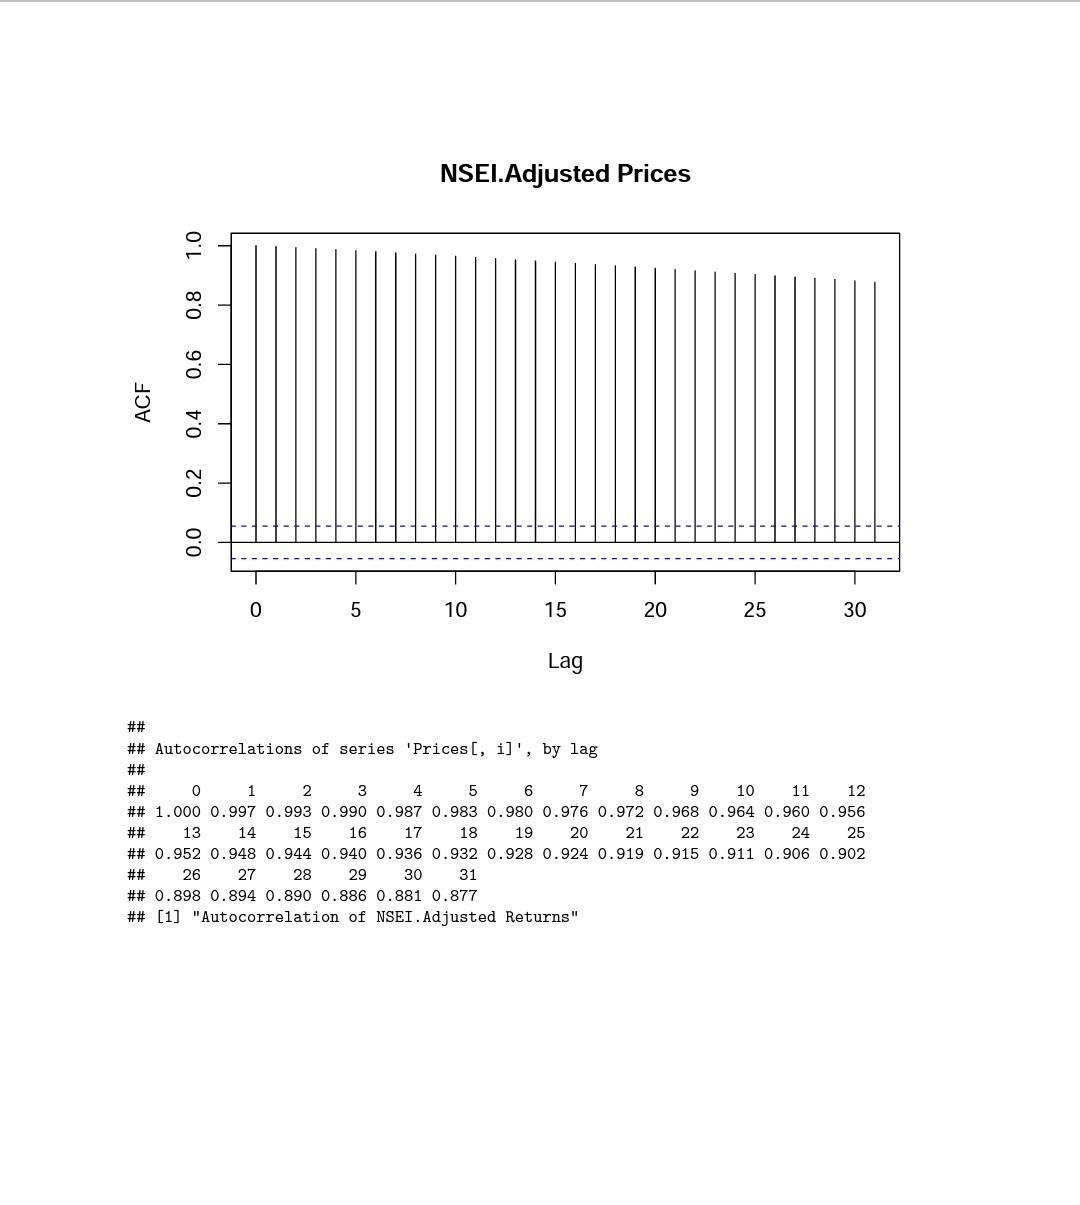
Comment on the descriptive statistics (i.e. minimum, maximum, mean, median, standard deviation, First quartile, and third quartile, skewness and kurtosis coefficients) of (i) Stock prices and daily returns of ITC.NS. Adjusted, (ii) Stock prices and daily returns of JSWSTEEL.NS. Adjusted, (iii) Stock prices and daily returns of NSEI Adjusted. Note: A detailed understanding will fetch more marks than a simple "greater than" or "less than" kind of responses. You can also take these companies as a representative of the respective industry and also comment. 38 NSEL.Adjusted Returns 1.0 0.6 0.8 ACF 0.0 0.2 0.4 0 5 O1 10 15 20 25 30 Lag 0 7 ## ## Autocorrelations of series 'returns[, i]', by lag ## ## 1 2 3 4 5 6 8 9 10 ## 1.000 -0.055 0.027 0.009 0.010 0.152 -0.151 0.106 0.004 -0.033 0.092 ## 11 12 13 14 15 16 17 18 19 20 21 ## -0.103 0.088 -0.018 -0.027 0.049 -0.051 0.052 -0.046 -0.002 0.029 -0.005 ## 22 23 24 25 26 27 28 29 30 31 ## 0.019 -0.017 -0.056 0.047 -0.021 -0.014 0.043 -0.035 0.023 -0.025 for (i in 1:7) { print (paste("Ljung Box Test of ", names (Prices[,i])," Prices")) print (Box.test(Prices[,i],lag =10, type = "Ljung-Box")) print (paste("Ljung Box Test of ", names (returns[i])," Returns")) print (Box.test(returns [,i],lag =10, type = "Ljung-Box")) } ## [1] "Ljung Box Test of DRREDDY.NS. Adjusted Prices" ## ## Box-Ljung test ## ## data: Prices[, i] ## X-squared = 12570, df = 10, p-value
Step by Step Solution
There are 3 Steps involved in it

Get step-by-step solutions from verified subject matter experts