

Question: comment on the fluctuations in your index ? - Compare the performance of each stock to the index and explain their relationship ? es, save
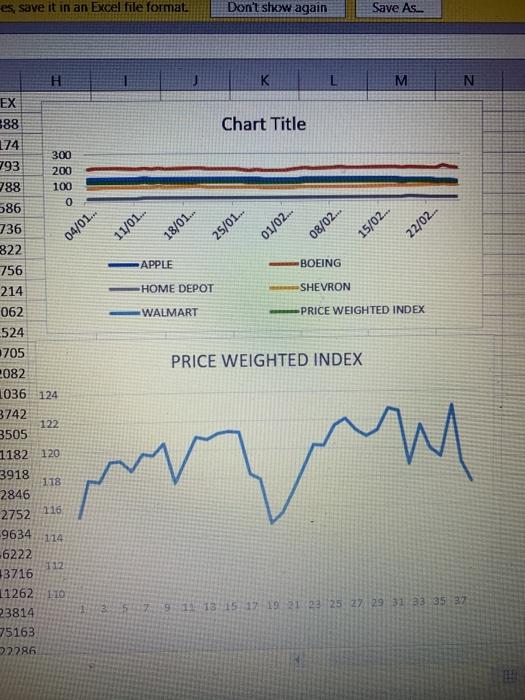
es, save it in an Excel file format Don't show again Save As. K L M N Chart Title EX 388 174 793 388 586 736 300 200 100 0 25/01... 01/02... 04/01... 11/01.. 18/01. 08/02... 15/02... 22/02... 822 APPLE BOEING HOME DEPOT SHEVRON WALMART PRICE WEIGHTED INDEX PRICE WEIGHTED INDEX 756 214 062 524 3705 2082 1036 124 3742 122 3505 1182 220 3918 118 2846 2752 116 mym 9634 114 -6222 112 3716 11262 10 3814 75163 22.286 91 13 15 17 19 21 23 25 27 29 31 33 35 37 es, save it in an Excel file format Don't show again Save As. K L M N Chart Title EX 388 174 793 388 586 736 300 200 100 0 25/01... 01/02... 04/01... 11/01.. 18/01. 08/02... 15/02... 22/02... 822 APPLE BOEING HOME DEPOT SHEVRON WALMART PRICE WEIGHTED INDEX PRICE WEIGHTED INDEX 756 214 062 524 3705 2082 1036 124 3742 122 3505 1182 220 3918 118 2846 2752 116 mym 9634 114 -6222 112 3716 11262 10 3814 75163 22.286 91 13 15 17 19 21 23 25 27 29 31 33 35 37
Step by Step Solution
There are 3 Steps involved in it

Get step-by-step solutions from verified subject matter experts