

Question: Selected data from the 2010 annual report of Frisch's Restaurants, Inc. follow: FRISCH'S RESTAURANTS, INC. AND SUBSIDIARIES* CONSOLIDATED BALANCE SHEET (In Part) June 1,
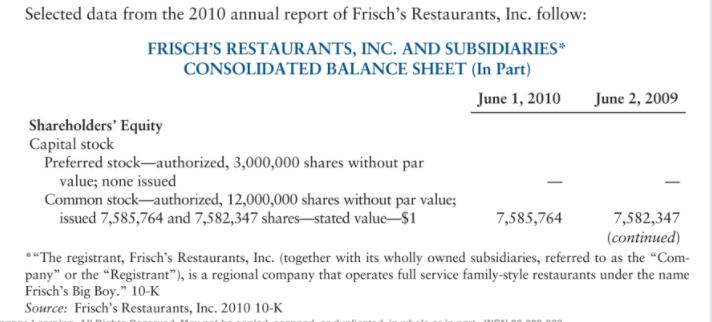

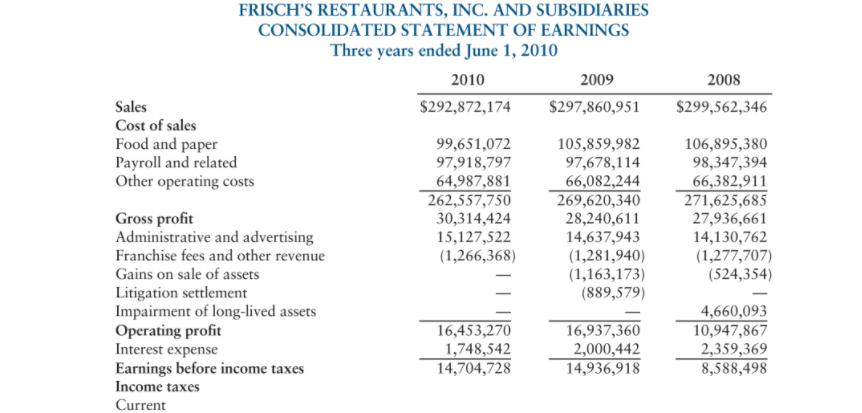
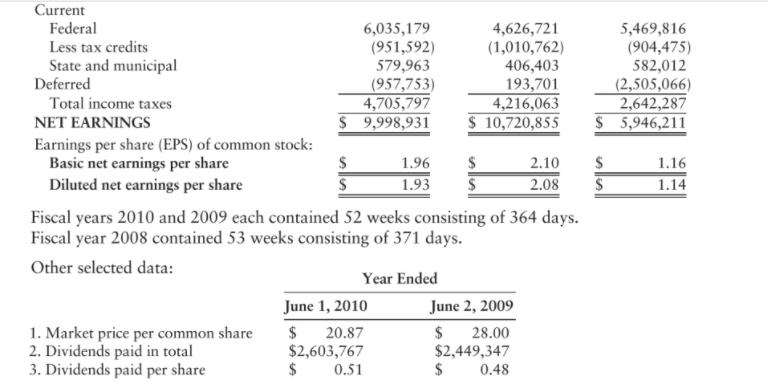
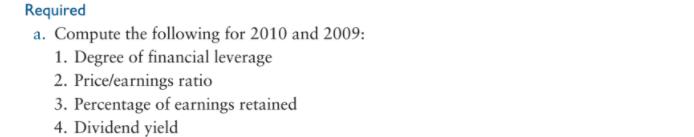
Selected data from the 2010 annual report of Frisch's Restaurants, Inc. follow: FRISCH'S RESTAURANTS, INC. AND SUBSIDIARIES* CONSOLIDATED BALANCE SHEET (In Part) June 1, 2010 Shareholders' Equity Capital stock Preferred stock-authorized, 3,000,000 shares without par value; none issued Common stock-authorized, 12,000,000 shares without par value; issued 7,585,764 and 7,582,347 shares-stated value-$1 7,585,764 June 2, 2009 7,582,347 (continued) **The registrant, Frisch's Restaurants, Inc. (together with its wholly owned subsidiaries, referred to as the "Com- pany" or the "Registrant"), is a regional company that operates full service family-style restaurants under the name Frisch's Big Boy." 10-K Source: Frisch's Restaurants, Inc. 2010 10-K Additional contributed capital Accumulated other comprehensive loss Retained earnings Less cost of treasury stock (2,525,174 and 2,482,233 shares) Total shareholders' equity Total liabilities and shareholders' equity June 2, 2009 64,721,328 72,303,675 (6,634,422) 82,306,488 75,672,066 (33,598,597) 114,377,144 $189,252,646 $176,975,948 June 1, 2010 65,222,878 72,808,642 (7,856,427) 89,701,652 81,845,225 (34,559,851) 120,094,016 FRISCH'S RESTAURANTS, INC. AND SUBSIDIARIES CONSOLIDATED STATEMENT OF EARNINGS Three years ended June 1, 2010 Sales Cost of sales Food and paper Payroll and related Other operating costs Gross profit Administrative and advertising Franchise fees and other revenue Gains on sale of assets Litigation settlement Impairment of long-lived assets Operating profit Interest expense Earnings before income taxes Income taxes Current 2010 $292,872,174 99,651,072 97,918,797 64,987,881 262,557,750 30,314,424 15,127,522 (1,266,368) 16,453,270 1,748,542 14,704,728 2009 $297,860,951 105,859,982 97,678,114 66,082,244 269,620,340 28,240,611 14,637,943 (1,281,940) (1,163,173) (889,579) 16,937,360 2,000,442 14,936,918 2008 $299,562,346 106,895,380 98,347,394 66,382,911 271,625,685 27,936,661 14,130,762 (1,277,707) (524,354) 4,660,093 10,947,867 2,359,369 8,588,498 Current Federal Less tax credits State and municipal Deferred Total income taxes NET EARNINGS Earnings per share (EPS) of common stock: Basic net earnings per share Diluted net earnings per share $ $ $ 1. Market price per common share 2. Dividends paid in total 3. Dividends paid per share 6,035,179 (951,592) 579,963 (957,753) 4,705,797 9,998,931 June 1, 2010 $ 20.87 $2,603,767 $ 0.51 4,626,721 (1,010,762) 406,403 193,701 4,216,063 $ 10,720,855 1.96 $ 1.93 $ Fiscal years 2010 and 2009 each contained 52 weeks consisting of 364 days. Fiscal year 2008 contained 53 weeks consisting of 371 days. Other selected data: Year Ended 2.10 2.08 June 2, 2009 $ 28.00 $2,449,347 $ 0.48 5,469,816 (904,475) 582,012 (2,505,066) 2,642,287 $ 5,946,211 $ S 1.16 1.14 Required a. Compute the following for 2010 and 2009: 1. Degree of financial leverage 2. Price/earnings ratio 3. Percentage of earnings retained 4. Dividend yield 5. Common stock-authorized 6. Common stock-issued 7. Treasury stock 8. Common stock outstanding 9. Book value per share b. Comment on the ratios computed under (a). c. 1. Identify special items on the income statement for the years 2010 and 2009. 2. How would these special items be removed from net earnings?
Step by Step Solution
3.48 Rating (158 Votes )
There are 3 Steps involved in it
Solution a a 1 Degree of Financial Leverage Earnings Before Interest and Tax Earnings Before Tax ... View full answer

Get step-by-step solutions from verified subject matter experts
Document Format (2 attachments)
635db35bb9d37_178127.pdf
180 KBs PDF File
635db35bb9d37_178127.docx
120 KBs Word File