

Question: Common-Size Financial Statement Analysis Using Excel Completing this activity will help you learn ta: 1. create Excei formulas using celli references: 2. create absolute cell
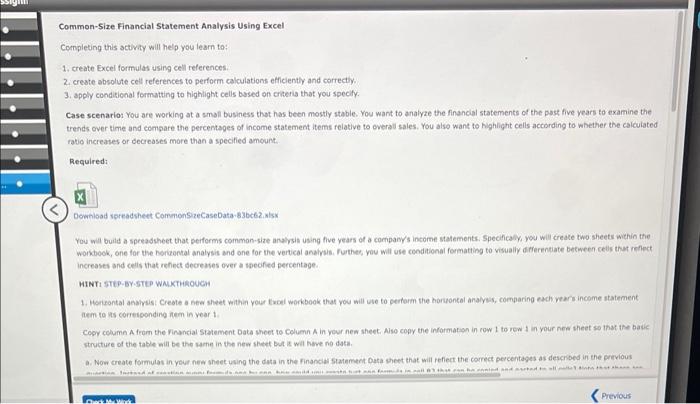
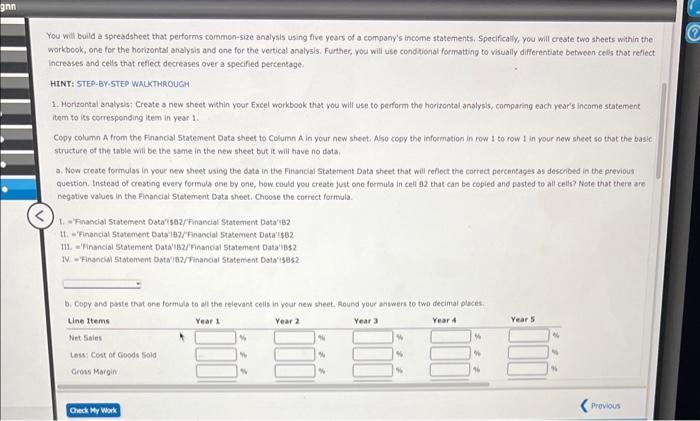
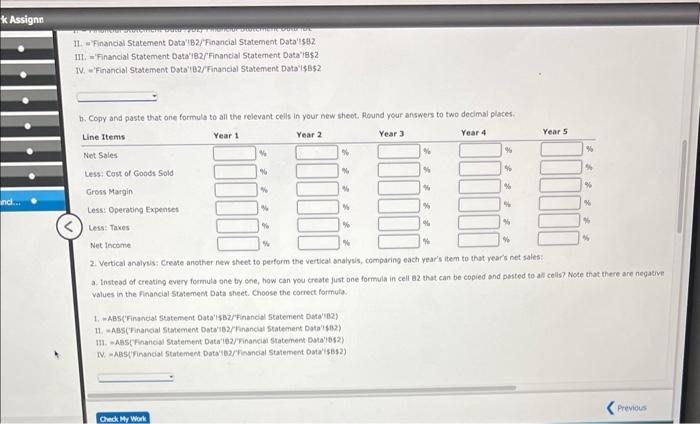
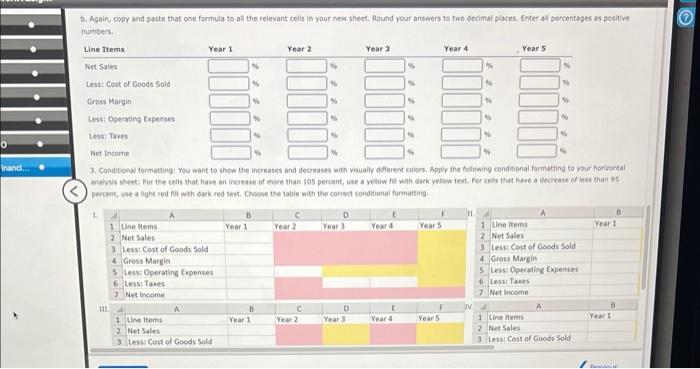
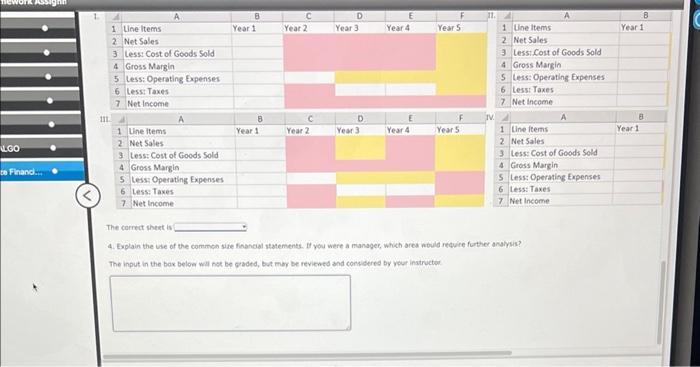
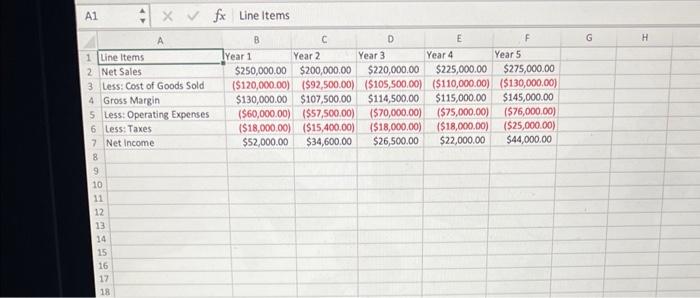
Common-Size Financial Statement Analysis Using Excel Completing this activity will help you learn ta: 1. create Excei formulas using celli references: 2. create absolute cell references to perform calculations efficiently and correcty. 3. appiy condieional formatting to highlight cells based on criteria that you specify. Case scenarios You are working at a smafl business that has been mostly stable. You want to analyze the financlal statements of the past five years to examine the trends over time and compare the percentsges of income statement items relative to overall sales. You also want to highlight cells according to whether the calcuiated ratio increases or decreases more than a specified amount. Required Downioad spreadsheet CommonS zeCaseData-83bc62.xisx You will build a spreadsheet that perferms common-size analysil using five years of a company's income statements: Specificaliy, you will create two sheets within the workbook, one for the horkontal analysis and one for the vertical analysis, further, you will use conditional formatting to visually deflerentiate between cells thut reflect increases and celis that refect decreases over a soeofed percentage. HINT STEP-BY-STLP WAXTHAOUGH 1. Horsontal analvis: Creote a nee sheet within your twoel workbook that you will wse to pertorm the horuontal analyus, comparing each vears income statement atem to its corresconding inem in year 1 . Cooy column A feem the Financial Statement Data sheet to Column A in your new sheet. Ase copy the information in row 1 to rew 1 in your nee sheet so that the batic structure of the table aill be the saene in the new sheet but is wal hive no data. a. Now create formulas in yeur new aheet using the data in the financidi Statement Data sheet that mill refiect the comrect percentages as described in the privious You will build a spreadsheet that performs common-size analysis using five years of a company's income statements. Specifically. you will create two sheets within the workbook, one for the horizontal analysis and one for the vertical analysis. Further, you will uso condtional formstting to visually differentiate between cells that reflect increases and cells that reflect decreases over a specified percentage. HINT: STEP-BY-STEP WALKTHROUGH 1. Horizontal analysis: Create a new sheet within your Excel workbook that you wilf use to perform the horizontal analysis, comparing each year's income statement item to its corresponding item in year 1 . Copy column A from the Financial 5tatement Data sheet to Column A in your new sheeti Also copy the infoemation in row 1 to row 1 in your new sheet so that the basic: structure of the table will be the same in the new sheet but it will have no dsta. a. Now create formulas in your new theet using the data in the Financial Statement Data sheet that will reflect the correct percentages as described in the previous question. Instead of creating every formula one by one, how could you create just one formula in ceil 82 that can be copied and pasted to all cells? Note that there are negative values in the Financial 5 tatement Data sheet. Choose the correct formula. 1. = Financial Statement Data'isbz/Financial Statement Data'Bz H. ='Financial 5 tatement Data'182/'Fnancial 5tatement Data' $82 11. ='Financial Statement Data'182/Financial Statement Data'bs\$ IV. = Financial 5 tatement Oata'is2/Tinancial Statement Dota's 1352 II w'Financia Statement Data'B2/Financial Statement Data'lsaz III. ='Financial Statement Datai82/Financial Statement Data'le\$2. IV. ='Financial Statement Dota'B2/Financial statement Data'15B52 b. Copy and paste that one formula to all the relevant cells in your new sheot. flound your answers to two decimal places. 2. Vertical analyus: Creste another new sheet to perform the vertical analyis, comparing each year's item to that years net saiea: a. Instead of creating every formula one by one, haw can you creote just one formula in cell az that can be copied and pasted to all cells? Note that there are negative: values in the financial Statement Data sheet. Choose the correct formula. 1. -ABs('Finandat statement Data'sBz/Financol statement Duta'be?) 14. = ABS (Financal Statement Datzrib2/Thancul statement Data'l4B2) 111. * ASSCFhancial Statement Data' 1 2/Financial Statement Cola'ibs2) NV. =-MBS(financal Statement Dats'B2/Financal Starement Data'sBs2) b. Again, copy and paste that one formula to all the reievant cells in your new sheet. found your answers to two eecimal places. Emer all percentages as positive numbers: 3. Conditionai formating You want to show the increases and decreases with visualiy defierem colors. Apply the folowing conditional formatting to your horitontal. analyes shet: For the celis that have an incrase of mere than tos percent, use a yellow fil with darik yetew text. For celly that huye a decrease of leav than os percent, use a light red fil wht dark red text. Choose the labie with the correct condional farmationg. 4. Explain the use of the common size financial statements. If you were a minager, which ares novld retwire further analysis? The input in the bax beloa wal nok be graded, but mor be reviewed and condidered by your inatructoe
Step by Step Solution
There are 3 Steps involved in it

Get step-by-step solutions from verified subject matter experts