

Question: Common-size statement analysis A common-size income statement for Creek Enterprises' 2018 operations follows :. Using the firm's 2019 income statement es, develop the 2019 common-size

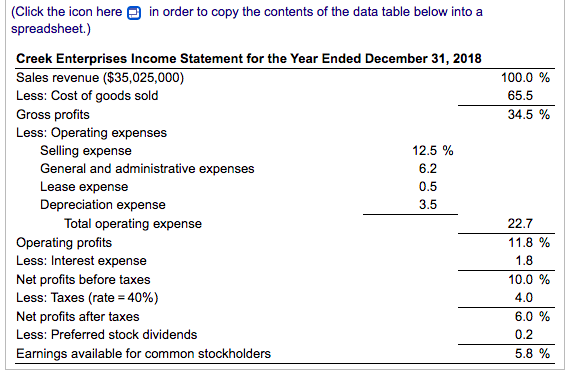
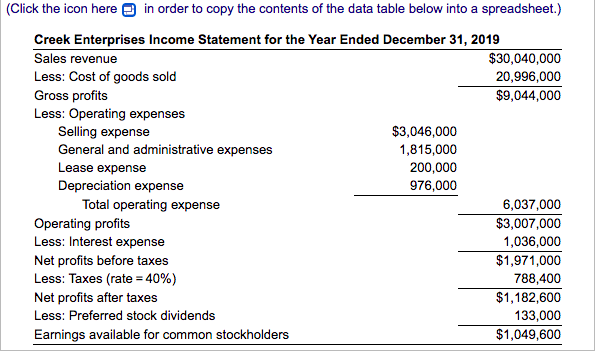
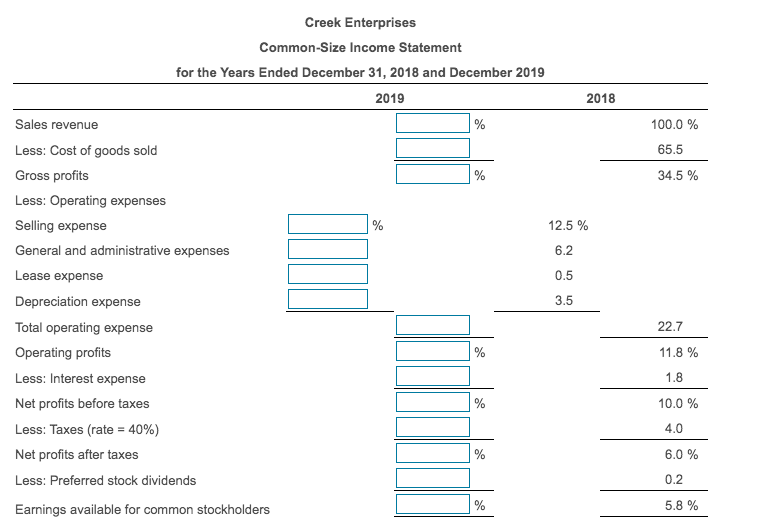
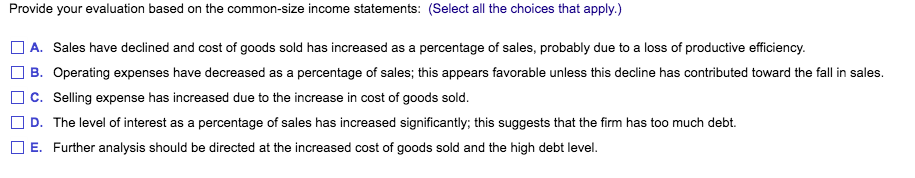
Common-size statement analysis A common-size income statement for Creek Enterprises' 2018 operations follows :. Using the firm's 2019 income statement es, develop the 2019 common-size income statement and compare it to the 2018statement. Which areas require further analysis and investigation? Complete the common-size income statement for the year ending December 31, 2019 and compare it to the common-size income statement for the year ending December 2018: (Round to one decimal place.) 100.0 % 65,5 34.5 % (Click the icon here in order to copy the contents of the data table below into a spreadsheet.) Creek Enterprises Income Statement for the Year Ended December 31, 2018 Sales revenue ($35,025,000) Less: Cost of goods sold Gross profits Less: Operating expenses Selling expense 12.5 % General and administrative expenses 6.2 Lease expense 0.5 Depreciation expense 3.5 Total operating expense Operating profits Less: Interest expense Net profits before taxes Less: Taxes (rate = 40%) Net profits after taxes Less: Preferred stock dividends Earnings available for common stockholders 22.7 11.8 % 1.8 10.0 % 4.0 6.0 % 0.2 5.8 % (Click the icon here in order to copy the contents of the data table below into a spreadsheet.) Creek Enterprises Income Statement for the Year Ended December 31, 2019 Sales revenue $30,040,000 Less: Cost of goods sold 20,996,000 Gross profits $9,044,000 Less: Operating expenses Selling expense $3,046,000 General and administrative expenses 1,815,000 Lease expense 200,000 Depreciation expense 976,000 Total operating expense 6,037,000 Operating profits $3,007,000 Less: Interest expense 1,036,000 Net profits before taxes $1,971,000 Less: Taxes (rate = 40%) 788,400 Net profits after taxes $1,182,600 Less: Preferred stock dividends 133,000 Earnings available for common stockholders $1,049,600 100.0 % 65.5 34.5% 6.2 Creek Enterprises Common-Size Income Statement for the Years Ended December 31, 2018 and December 2019 2019 2018 Sales revenue % Less: Cost of goods sold Gross profits % Less: Operating expenses Selling expense % 12.5% General and administrative expenses Lease expense Depreciation expense 3.5 Total operating expense Operating profits % Less: Interest expense Net profits before taxes % Less: Taxes (rate = 40%) Net profits after taxes % Less: Preferred stock dividends Earnings available for common stockholders % 0.5 22.7 11.8 % 1.8 10.0 % 4.0 6.0 % 0.2 5.8 % Provide your evaluation based on the common-size income statements: (Select all the choices that apply.) A. Sales have declined and cost of goods sold has increased as a percentage of sales, probably due to a loss of productive efficiency. B. Operating expenses have decreased as a percentage of sales; this appears favorable unless this decline has contributed toward the fall in sales. C. Selling expense has increased due to the increase in cost of goods sold. D. The level of interest as a percentage of sales has increased significantly; this suggests that the firm has too much debt. E. Further analysis should be directed at the increased cost of goods sold and the high debt level
Step by Step Solution
There are 3 Steps involved in it

Get step-by-step solutions from verified subject matter experts