

Question: Comp Business analytics Directions: . Create a Laboratory Report that includes the application of the above lessons. . Specific to the topics and the datasets
Comp Business analytics
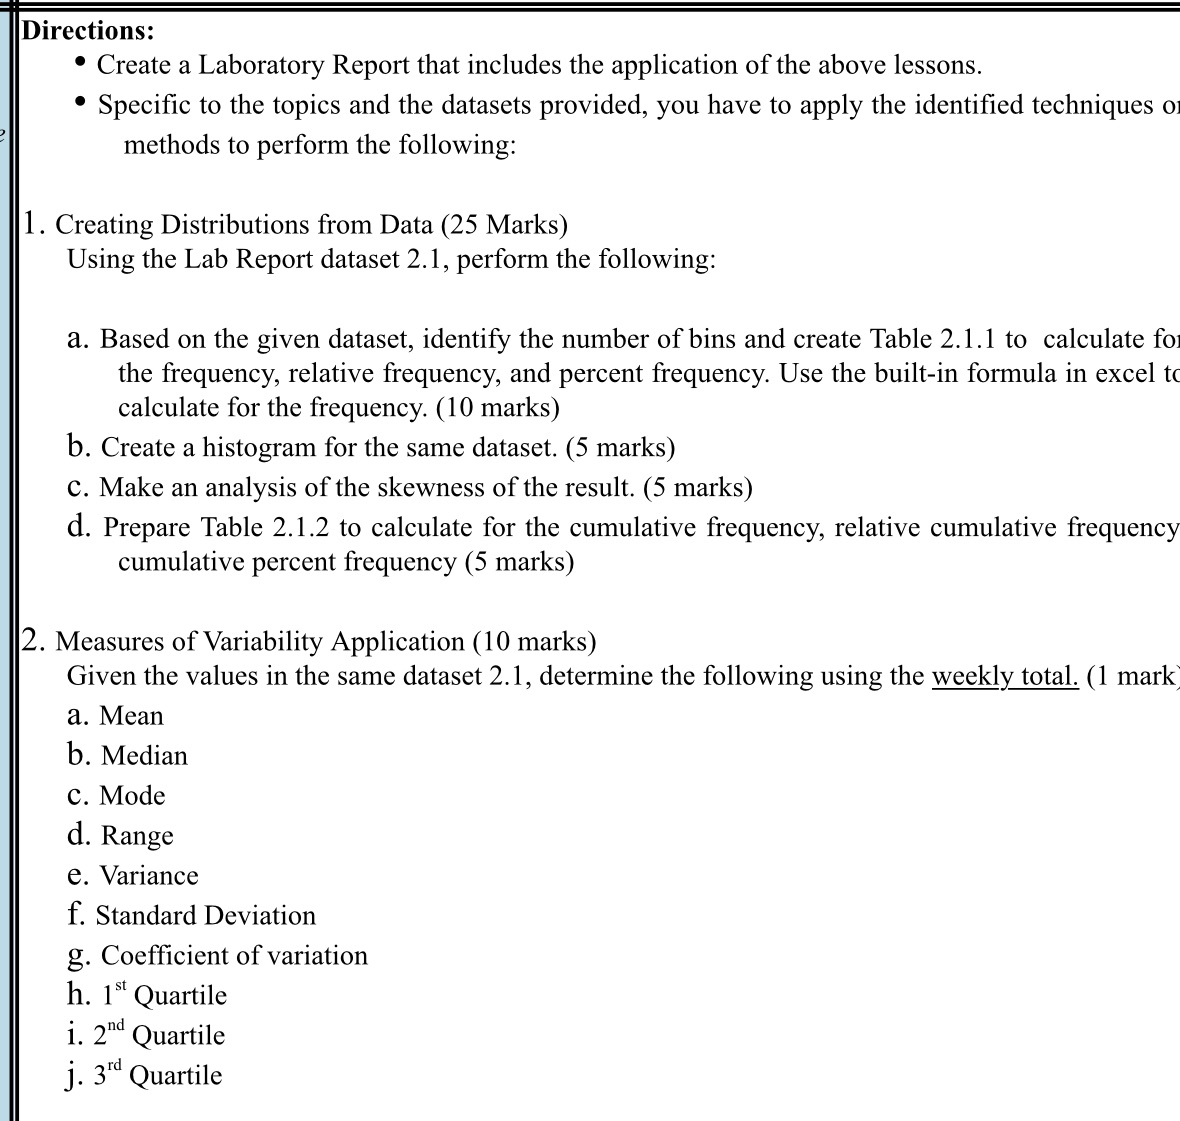
Directions: . Create a Laboratory Report that includes the application of the above lessons. . Specific to the topics and the datasets provided, you have to apply the identified techniques o methods to perform the following: 1. Creating Distributions from Data (25 Marks) Using the Lab Report dataset 2.1, perform the following: a. Based on the given dataset, identify the number of bins and create Table 2.1.1 to calculate for the frequency, relative frequency, and percent frequency. Use the built-in formula in excel to calculate for the frequency. (10 marks) b. Create a histogram for the same dataset. (5 marks) C. Make an analysis of the skewness of the result. (5 marks) d. Prepare Table 2.1.2 to calculate for the cumulative frequency, relative cumulative frequency cumulative percent frequency (5 marks) 2. Measures of Variability Application (10 marks) Given the values in the same dataset 2.1, determine the following using the weekly total. (1 mark a. Mean b. Median c. Mode d. Range e. Variance f. Standard Deviation g. Coefficient of variation h. 1 st Quartile 1. 2"d Quartile j. 3"d Quartile
Step by Step Solution
There are 3 Steps involved in it

Get step-by-step solutions from verified subject matter experts