

Question: companies. lo do so, you will need to be able to change data from continuous to discrete. Use the following steps to create the charts
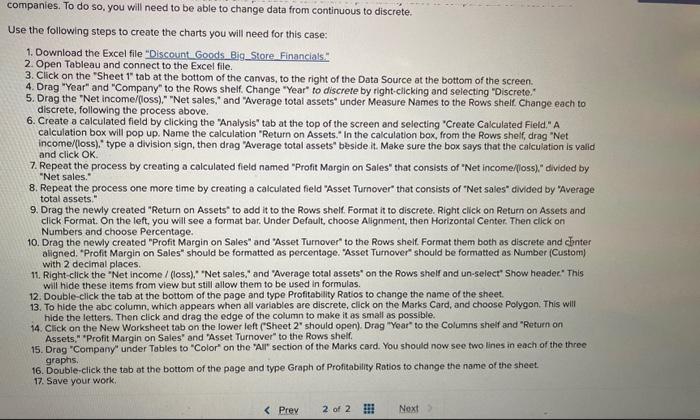
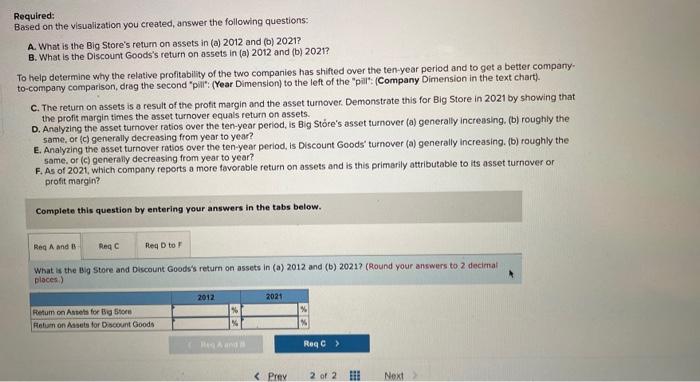

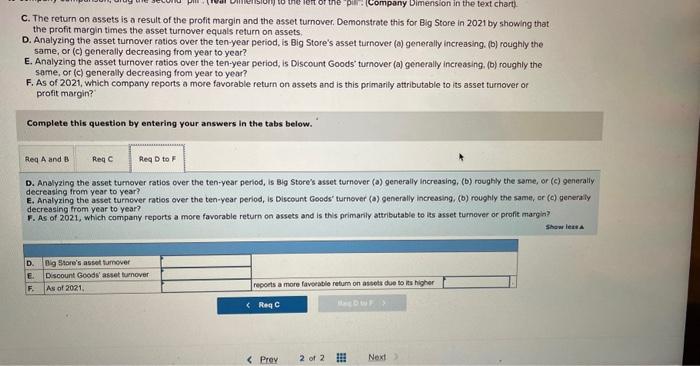
companies. lo do so, you will need to be able to change data from continuous to discrete. Use the following steps to create the charts you will need for this case: 1. Download the Excel file "Discount Goods Big_Store. Financials." 2. Open Tableau and connect to the Excel file. 3. Click on the "Sheet 1" tab at the bottom of the canvas, to the right of the Data Source at the bottom of the screen. 4. Drag "Year" and "Company" to the Rows shelf. Change "Year" to discrete by right-clicking and selecting "Discrete:" 5. Drag the "Net income/(loss)," "Net sales," and "Average total assets" under Measure Names to the Rows shelf. Change each to discrete, following the process above. 6. Create a calculated field by clicking the "Analysis" tab at the top of the screen and selecting "Create Calculated Field, " A calculation box will pop up. Name the calculation "Return on Assets." In the calculation box, from the Rows shelf, drag "Net income/(loss)." type a division sign, then drag "Average total assets" beside it. Make sure the box says that the calculation is valid and click OK. 7. Repeat the process by creating a calculated field named "Profit Margin on Sales" that consists of "Net income/(loss)," divided by "Net sales." 8. Repeat the process one more time by creating a calculated field "Asset Turnover" that consists of "Net sales" divided by "Average total assets." 9. Drag the newly created "Return on Assets" to add it to the Rows shelf. Format it to discrete. Right click on Return on Assets and click Format. On the left, you will see a format bar. Under Default, choose Alignment, then Horizontal Center. Then click on Numbers and choose Percentage. 10. Drag the newly created "Profit Margin on Sales" and "Asset Turnover" to the Rows shelf. Format them both as discrete and clnter aligned. "Profit Margin on Sales" should be formatted as percentage. "Asset Turnover" should be formatted as Number (Custom) with 2 decimal places. 11. Right-cick the "Net income / (loss), " Net sales," and "Average total assets" on the Rows sheif and un-select" Show heedec" This will hide these items from view but still allow them to be used in formulas. 12. Double-click the tab at the bottom of the page and type Profitability Ratios to change the name of the sheet. 13. To hide the abc column, which appears when all variables are discrete, click on the Marks Card, and choose Polygon, This will hide the letters. Then click and drag the edge of the column to make it as small as possible. 14. Click on the New Worksheet tab on the lower left ("Sheet 2" should open). Drag "Year" to the Columns sheif and "Return on Assets," "Profit Margin on Sales" and "Asset Turnover" to the Rows shelf. 15. Drag "Company" under Tables to "Color" on the "All' section of the Marks card. You should now see two lines in each of the three graphis. 16. Double-click the tab at the bottom of the page and type Graph of Profitability Ratios to change the name of the sheet. 17. Save your work. Required: Based on the visualization you created, answer the following questions: A. What is the Big Store's retum on assets in (a) 2012 and (o) 2021? B. What is the Discount Goods's return on assets in (a) 2012 and (b) 2021? To help determine why the relative profitability of the two companies has shifted over the ten-year period and to get a better comparty" to-company comparison, drag the second "pill": (Year Dimension) to the left of the "pill": (Company Dimension in the text chart). C. The retum on assets is a result of the profit margin and the asset tumover. Demonstrate this for Big Store in 2021 by showing that the profit margin times the asset turnover equals return on assets. D. Analyzing the asset turnover ratios over the ten-year period, is Bigg Stobre's asset turnover (a) generally increasing. (b) roughly the same, or (c) generally decreasing from year to year? E. Analyzing the asset turnover ratios over the ten-year period, is Discount Goods' turnover (a) generally increasing. (b) roughly the same. or (c) generally decreasing from year to year? F. As of 2021, which company reports a more favorable return on assets and is this primarily attributable to its asset turnover or profit margin? Complete this question by entering your answers in the tabs below. What is the Big Store and Discount Goods's return on assets in (a) 2012 and (b) 2021 ? (Round your answers to.2 decirnal places? Required: Based on the visualization you created, answer the following questions: A. What is the Big Store's return on assets in (o) 2012 and (b) 2021 ? B. What is the Discount Goods's return on assets in (a) 2012 and (b) 2021? ? To help determine why the relative profitability of the two companies has shifted over the ten-yeor period and to get a better company to-company comparison, drag the second "pill": (Year Dimension) to the left of the "pili: (Company Dimension in the toxt chart). C. The return on assets is a result of the profit margin and the asset turnover. Demonstrate this for Big Store in 2021 by showing that the profit margin times the asset turnover equals return on assets. D. Analyzing the asset turnover ratios over the ten-year period, is Big Store's asset turnover (a) generally increasing. (b) roughly the same, or (c) generally decreasing from year to year? E. Analyzing the asset turnover ratios over the ten-year period, is Discount Goods" turnover (a) generally increasing. (b) roughly the 5 ame, or (c) generally decreasing from year to year? F. As of 2021, which company reports a more fovorable return on assets and is this primarily attributable to its asset turnover of profit margin? Complete this question by entering your answers in the tabs below. The return on assets is a result of the proft margin and the asset turnover. Demonstrate this for Big Store in 2021 by showing that the profit margin times the asset turnover equals retum on assets. (Round your answers to 2 decimal places.) C. The return on assets is a result of the profit margin and the asset turnover. Demonstrate this for Blg Store in 2021 by showing that the profit margin times the asset turnover equals return on assets, D. Analyzing the asset tumover ratios over the ten-year period, is Big Store's asset turnover (o) generally increasing, (b) roughly the same, or (c) generally decreasing from year to year? E. Analyzing the asset turnover ratios over the ten-year period, is Discount Goods" turnover (a) generally increasing, (b) roughly the same, or (c) generally decreasing from year to year? F. As of 2021, which company reports a more favorable return on assets and is this primarily attributable to its asset turnover or profit margin? Complete this question by entering your answers in the tabs below. D. Analyzing the asset tumover ratios over the ten-year period, is 8ig Store's asset turnover (o) generally increasing, (b) roughily the same, or (c) generally decreasing from year to year? E. Analyzing the asset turnover ratios over the ten-year period, is Discount Goods' tumover (o) generally increasing, (b) roughly the same, or (o) generally decreasing from year to year? F. As of 2021, which company reports a more favorable return on assets and is this primarily attributable to its asset turnover or profit margin? companies. lo do so, you will need to be able to change data from continuous to discrete. Use the following steps to create the charts you will need for this case: 1. Download the Excel file "Discount Goods Big_Store. Financials." 2. Open Tableau and connect to the Excel file. 3. Click on the "Sheet 1" tab at the bottom of the canvas, to the right of the Data Source at the bottom of the screen. 4. Drag "Year" and "Company" to the Rows shelf. Change "Year" to discrete by right-clicking and selecting "Discrete:" 5. Drag the "Net income/(loss)," "Net sales," and "Average total assets" under Measure Names to the Rows shelf. Change each to discrete, following the process above. 6. Create a calculated field by clicking the "Analysis" tab at the top of the screen and selecting "Create Calculated Field, " A calculation box will pop up. Name the calculation "Return on Assets." In the calculation box, from the Rows shelf, drag "Net income/(loss)." type a division sign, then drag "Average total assets" beside it. Make sure the box says that the calculation is valid and click OK. 7. Repeat the process by creating a calculated field named "Profit Margin on Sales" that consists of "Net income/(loss)," divided by "Net sales." 8. Repeat the process one more time by creating a calculated field "Asset Turnover" that consists of "Net sales" divided by "Average total assets." 9. Drag the newly created "Return on Assets" to add it to the Rows shelf. Format it to discrete. Right click on Return on Assets and click Format. On the left, you will see a format bar. Under Default, choose Alignment, then Horizontal Center. Then click on Numbers and choose Percentage. 10. Drag the newly created "Profit Margin on Sales" and "Asset Turnover" to the Rows shelf. Format them both as discrete and clnter aligned. "Profit Margin on Sales" should be formatted as percentage. "Asset Turnover" should be formatted as Number (Custom) with 2 decimal places. 11. Right-cick the "Net income / (loss), " Net sales," and "Average total assets" on the Rows sheif and un-select" Show heedec" This will hide these items from view but still allow them to be used in formulas. 12. Double-click the tab at the bottom of the page and type Profitability Ratios to change the name of the sheet. 13. To hide the abc column, which appears when all variables are discrete, click on the Marks Card, and choose Polygon, This will hide the letters. Then click and drag the edge of the column to make it as small as possible. 14. Click on the New Worksheet tab on the lower left ("Sheet 2" should open). Drag "Year" to the Columns sheif and "Return on Assets," "Profit Margin on Sales" and "Asset Turnover" to the Rows shelf. 15. Drag "Company" under Tables to "Color" on the "All' section of the Marks card. You should now see two lines in each of the three graphis. 16. Double-click the tab at the bottom of the page and type Graph of Profitability Ratios to change the name of the sheet. 17. Save your work. Required: Based on the visualization you created, answer the following questions: A. What is the Big Store's retum on assets in (a) 2012 and (o) 2021? B. What is the Discount Goods's return on assets in (a) 2012 and (b) 2021? To help determine why the relative profitability of the two companies has shifted over the ten-year period and to get a better comparty" to-company comparison, drag the second "pill": (Year Dimension) to the left of the "pill": (Company Dimension in the text chart). C. The retum on assets is a result of the profit margin and the asset tumover. Demonstrate this for Big Store in 2021 by showing that the profit margin times the asset turnover equals return on assets. D. Analyzing the asset turnover ratios over the ten-year period, is Bigg Stobre's asset turnover (a) generally increasing. (b) roughly the same, or (c) generally decreasing from year to year? E. Analyzing the asset turnover ratios over the ten-year period, is Discount Goods' turnover (a) generally increasing. (b) roughly the same. or (c) generally decreasing from year to year? F. As of 2021, which company reports a more favorable return on assets and is this primarily attributable to its asset turnover or profit margin? Complete this question by entering your answers in the tabs below. What is the Big Store and Discount Goods's return on assets in (a) 2012 and (b) 2021 ? (Round your answers to.2 decirnal places? Required: Based on the visualization you created, answer the following questions: A. What is the Big Store's return on assets in (o) 2012 and (b) 2021 ? B. What is the Discount Goods's return on assets in (a) 2012 and (b) 2021? ? To help determine why the relative profitability of the two companies has shifted over the ten-yeor period and to get a better company to-company comparison, drag the second "pill": (Year Dimension) to the left of the "pili: (Company Dimension in the toxt chart). C. The return on assets is a result of the profit margin and the asset turnover. Demonstrate this for Big Store in 2021 by showing that the profit margin times the asset turnover equals return on assets. D. Analyzing the asset turnover ratios over the ten-year period, is Big Store's asset turnover (a) generally increasing. (b) roughly the same, or (c) generally decreasing from year to year? E. Analyzing the asset turnover ratios over the ten-year period, is Discount Goods" turnover (a) generally increasing. (b) roughly the 5 ame, or (c) generally decreasing from year to year? F. As of 2021, which company reports a more fovorable return on assets and is this primarily attributable to its asset turnover of profit margin? Complete this question by entering your answers in the tabs below. The return on assets is a result of the proft margin and the asset turnover. Demonstrate this for Big Store in 2021 by showing that the profit margin times the asset turnover equals retum on assets. (Round your answers to 2 decimal places.) C. The return on assets is a result of the profit margin and the asset turnover. Demonstrate this for Blg Store in 2021 by showing that the profit margin times the asset turnover equals return on assets, D. Analyzing the asset tumover ratios over the ten-year period, is Big Store's asset turnover (o) generally increasing, (b) roughly the same, or (c) generally decreasing from year to year? E. Analyzing the asset turnover ratios over the ten-year period, is Discount Goods" turnover (a) generally increasing, (b) roughly the same, or (c) generally decreasing from year to year? F. As of 2021, which company reports a more favorable return on assets and is this primarily attributable to its asset turnover or profit margin? Complete this question by entering your answers in the tabs below. D. Analyzing the asset tumover ratios over the ten-year period, is 8ig Store's asset turnover (o) generally increasing, (b) roughily the same, or (c) generally decreasing from year to year? E. Analyzing the asset turnover ratios over the ten-year period, is Discount Goods' tumover (o) generally increasing, (b) roughly the same, or (o) generally decreasing from year to year? F. As of 2021, which company reports a more favorable return on assets and is this primarily attributable to its asset turnover or profit margin
Step by Step Solution
There are 3 Steps involved in it

Get step-by-step solutions from verified subject matter experts