

Question: Company Name: Amcor Plc Question: Making Decisions about Materiality Guide Plan: Defining a dollar amount or percentage that represents a material misstatement based on the
Company Name: Amcor Plc
Question: Making Decisions about Materiality
Guide Plan: Defining a dollar amount or percentage that represents a material misstatement based on the size and nature of Amcor's business. Anything above this threshold would require further investigation.
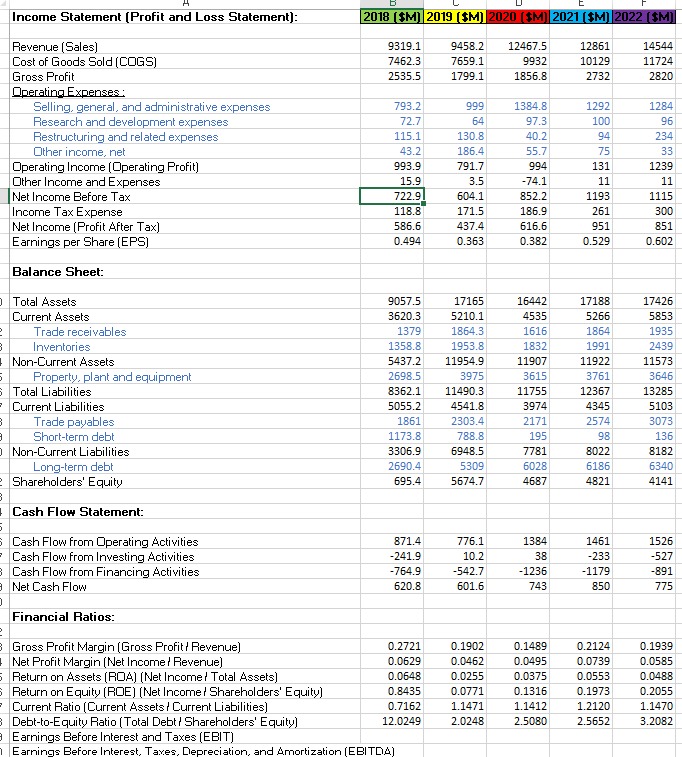
Income Statement [Profit and Loss Statement]: 2018 ($M) 2019 ($M) 2020 (SM) 2021 ($M) 2022 ($M) Revenue [ Sales] 9319.1 9458.2 12467.5 12861 14544 Cost of Goods Sold [COGS) 7462.3 7659.1 9932 10129 11724 Gross Profit 2535.5 1799.1 1856.8 2732 2820 Operating Expenses : Selling. general, and administrative expenses 793.2 999 1384.8 1292 1284 Research and development expenses 72.7 64 97.3 100 96 Restructuring and related expenses 115.1 130.8 40.2 94 234 Ither income, net 43.2 186.4 55.7 75 33 Operating Income [Operating Profit] 993.9 791.7 994 131 1239 Other Income and Expenses 15.9 3.5 -74.1 11 11 Net Income Before Tax 722.91 604.1 852.2 1193 1115 Income Tax Expense 118.8 171.5 186.9 261 300 Net Income [ Profit After Tax) 586.6 437.4 616.6 951 351 Earnings per Share [EPS) 0.494 0.363 0.382 0.529 0.602 Balance Sheet: Total Assets 9057.5 17165 16442 17188 17426 Current Assets 8620.3 5210.1 4535 5266 5853 Trade receivables 1379 1864.3 1616 1864 1935 Inventories 1358.8 1953.8 1832 1991 2439 Non-Current Assets 5437.2 11954.9 11907 11922 11573 Property, plant and equipment 2698.5 3975 3615 3761 3646 Total Liabilities 8362.1 11490.3 11755 12367 13285 Current Liabilities 5055.2 4541.8 3974 4345 5103 Trade payables 1861 2303.4 2171 2574 3073 Short-term debt 1173.8 788.8 195 98 136 Non-Current Liabilities 3306.9 6948.5 7781 8027 8182 Long-term debt 2690.4 5309 6028 6186 6340 Shareholders' Equity 695.4 5674.7 4687 4821 4141 Cash Flow Statement: Cash Flow from Operating Activities 871.4 776.1 1384 1461 1526 Cash Flow from Investing Activities 241.9 10.2 38 -233 -527 Cash Flow from Financing Activities -764.9 -542.7 -1236 -1179 -891 Net Cash Flow 620.8 601.6 743 850 775 Financial Ratios: Gross Profit Margin [Gross Profit / Revenue] 0.2721 0.1902 0.1489 0.2124 0.1939 Net Profit Margin [ Net Income / Revenue] 0.0629 0.0462 0.0495 0.0739 0.0585 Return on Assets [ROA) (Net Income/ Total Assets) 0.0648 0.0255 0.0375 0.0553 0.0488 Return on Equity [ROE) (Net Income / Shareholders' Equity) 0.8435 0.0771 0.1316 0.1973 0.2055 Current Ratio [ Current Assets / Current Liabilities] 0.7162 1.1471 1.1412 1.2120 1.1470 Debt-to-Equity Ratio [ Total Debt / Shareholders' Equity) 12.0249 2.0248 2.5080 2.5652 3.2082 Earnings Before Interest and Taxes [EBIT) Earnings Before Interest, Taxes, Depreciation, nd Amortization (EBITDA)
Step by Step Solution
There are 3 Steps involved in it

Get step-by-step solutions from verified subject matter experts