

Question: Comparative Advantage : Discuss the Comparative Advantage (With Trade) simulation that you played in Module Two. You should add the Production Decisions graph and the
- Comparative Advantage: Discuss the Comparative Advantage (With Trade) simulation that you played in Module Two. You should add the Production Decisions graph and the Production Trade graph (i.e., the graph showing how many hamburgers per fries) from you simulation report into the project template as Figures 1.1 and 1.2. Then, answer the following questions in the paragraphs below the figures:
- How does this simulation demonstrate how individuals evaluate opportunity costs to make business decisions? Use the Production Decisions graph from the simulation as a reference to explain what role the production-possibility frontier (PPF) has in the decision-making process.
- Explain how comparative advantage impacts a firm's decision to engage in trade. Would a business's decision to trade cause a change to its PPF? Provide specific reasoning to support your claims.
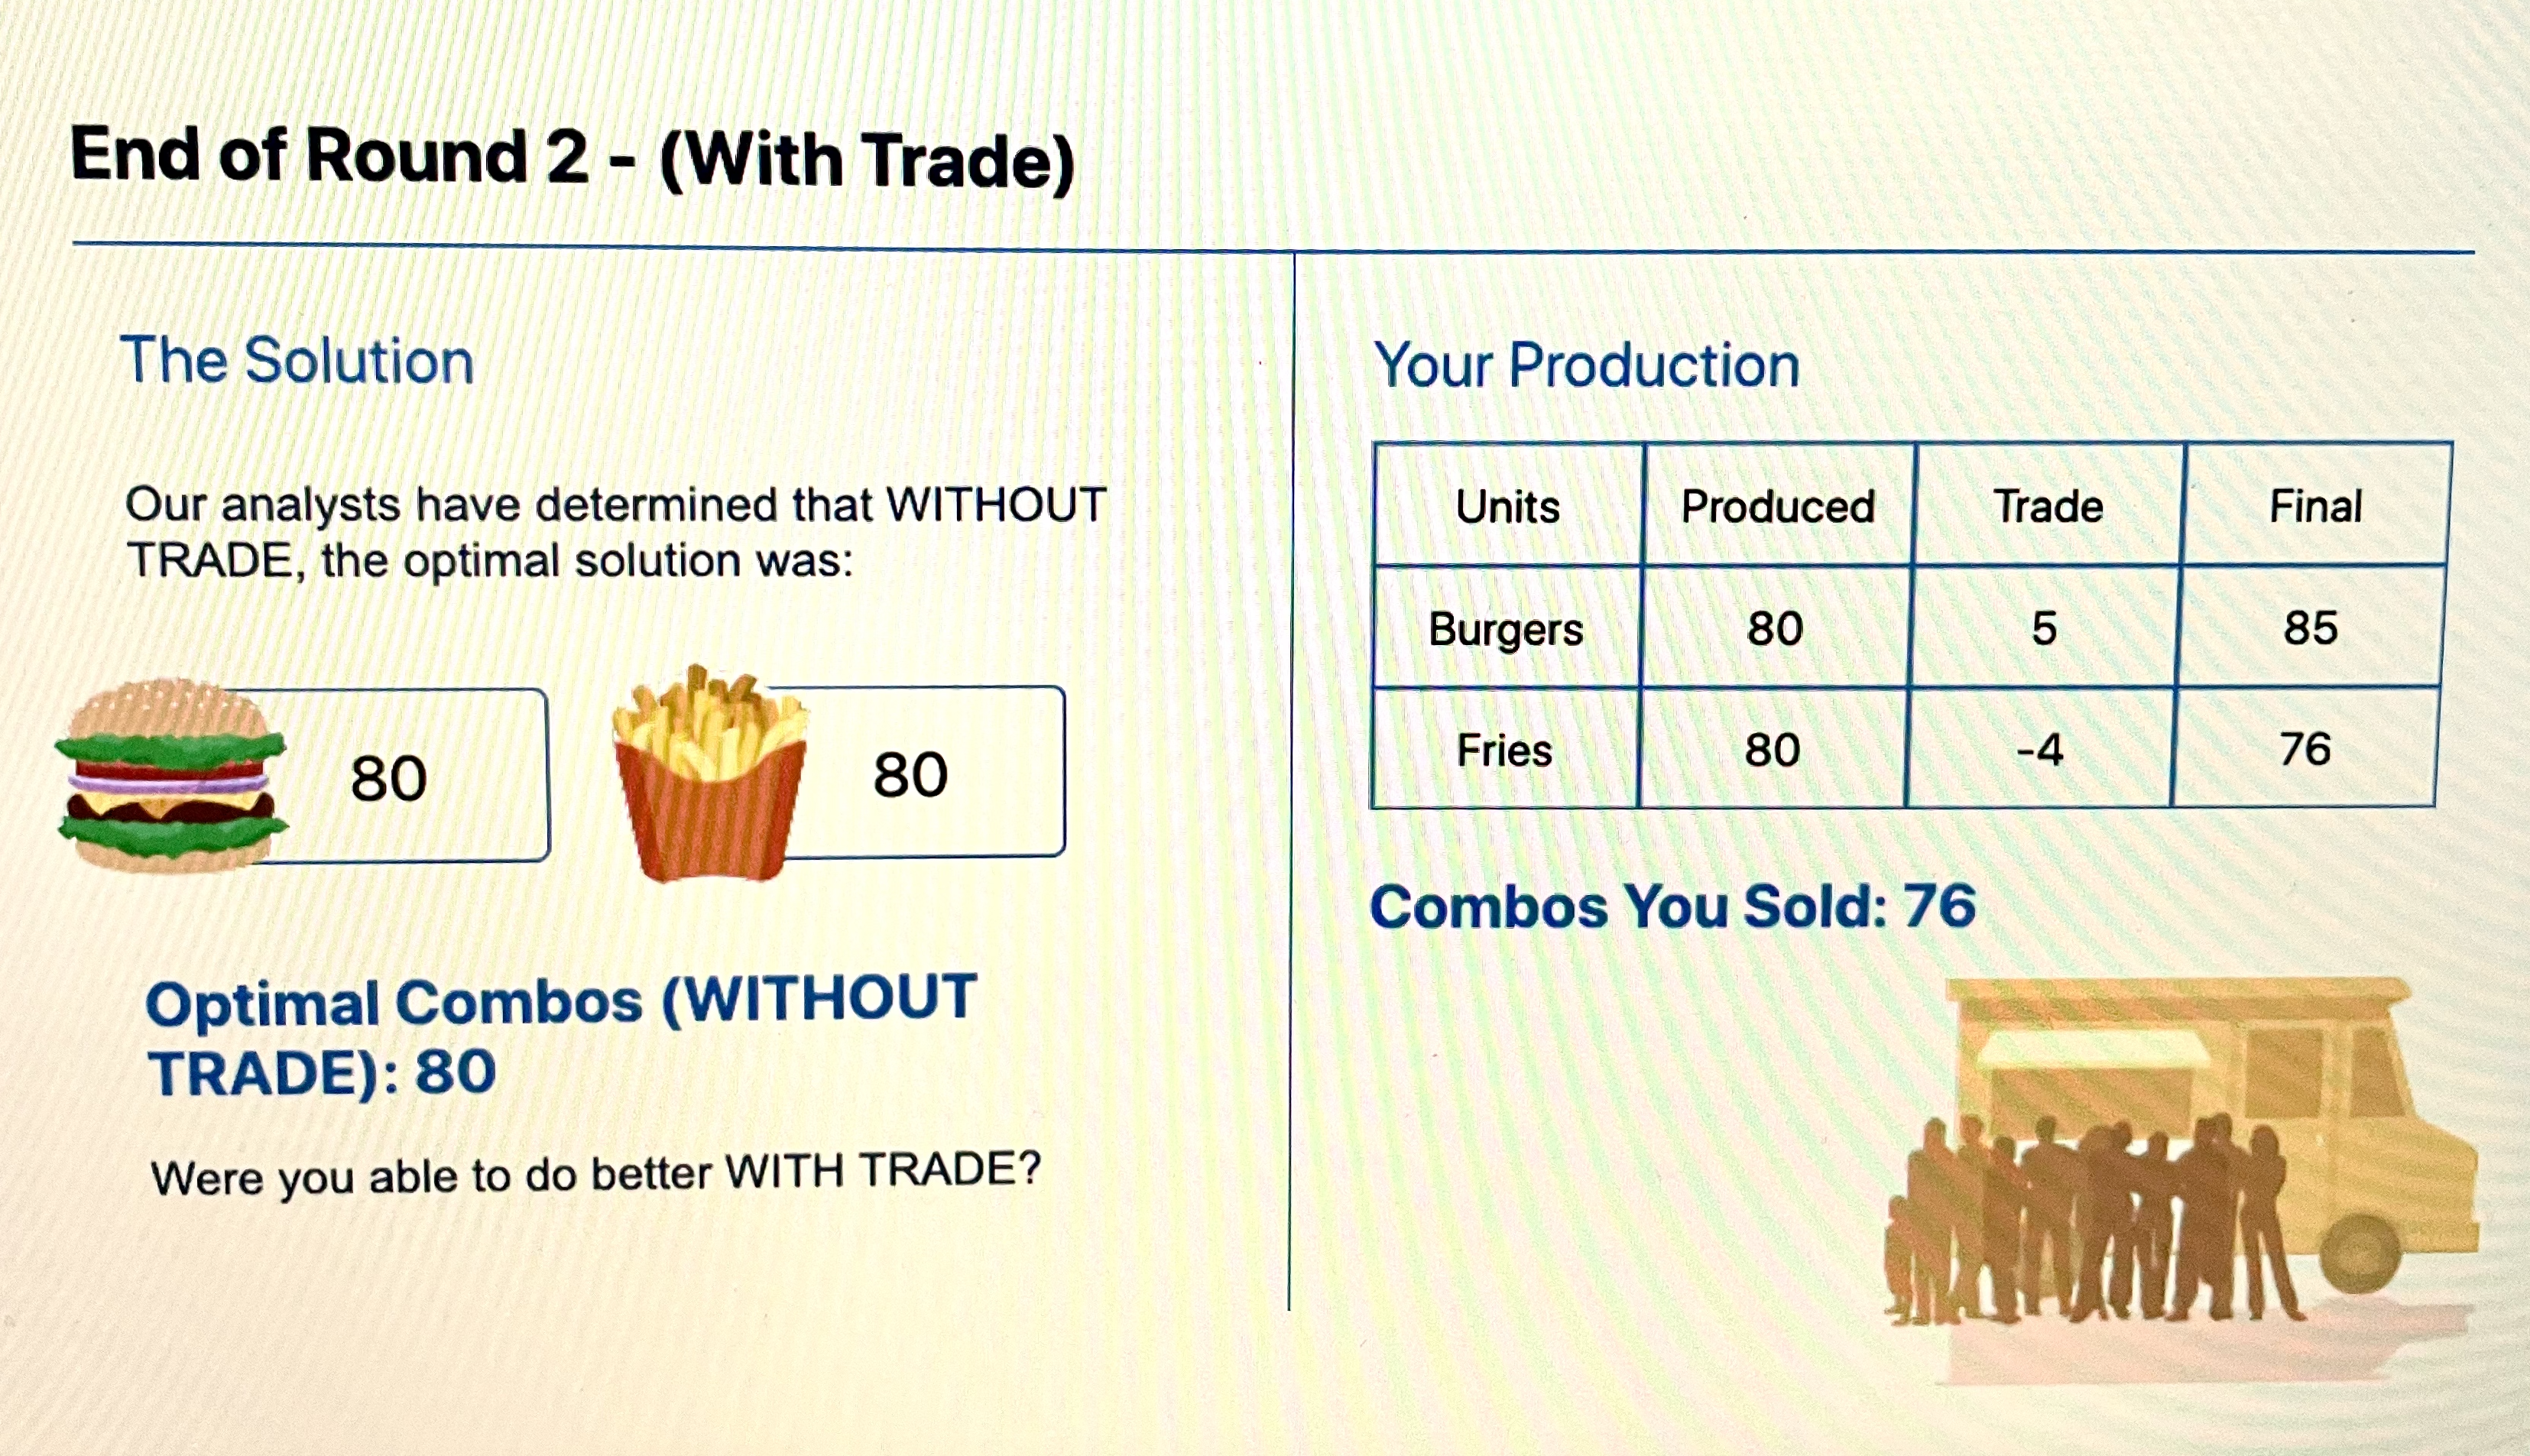
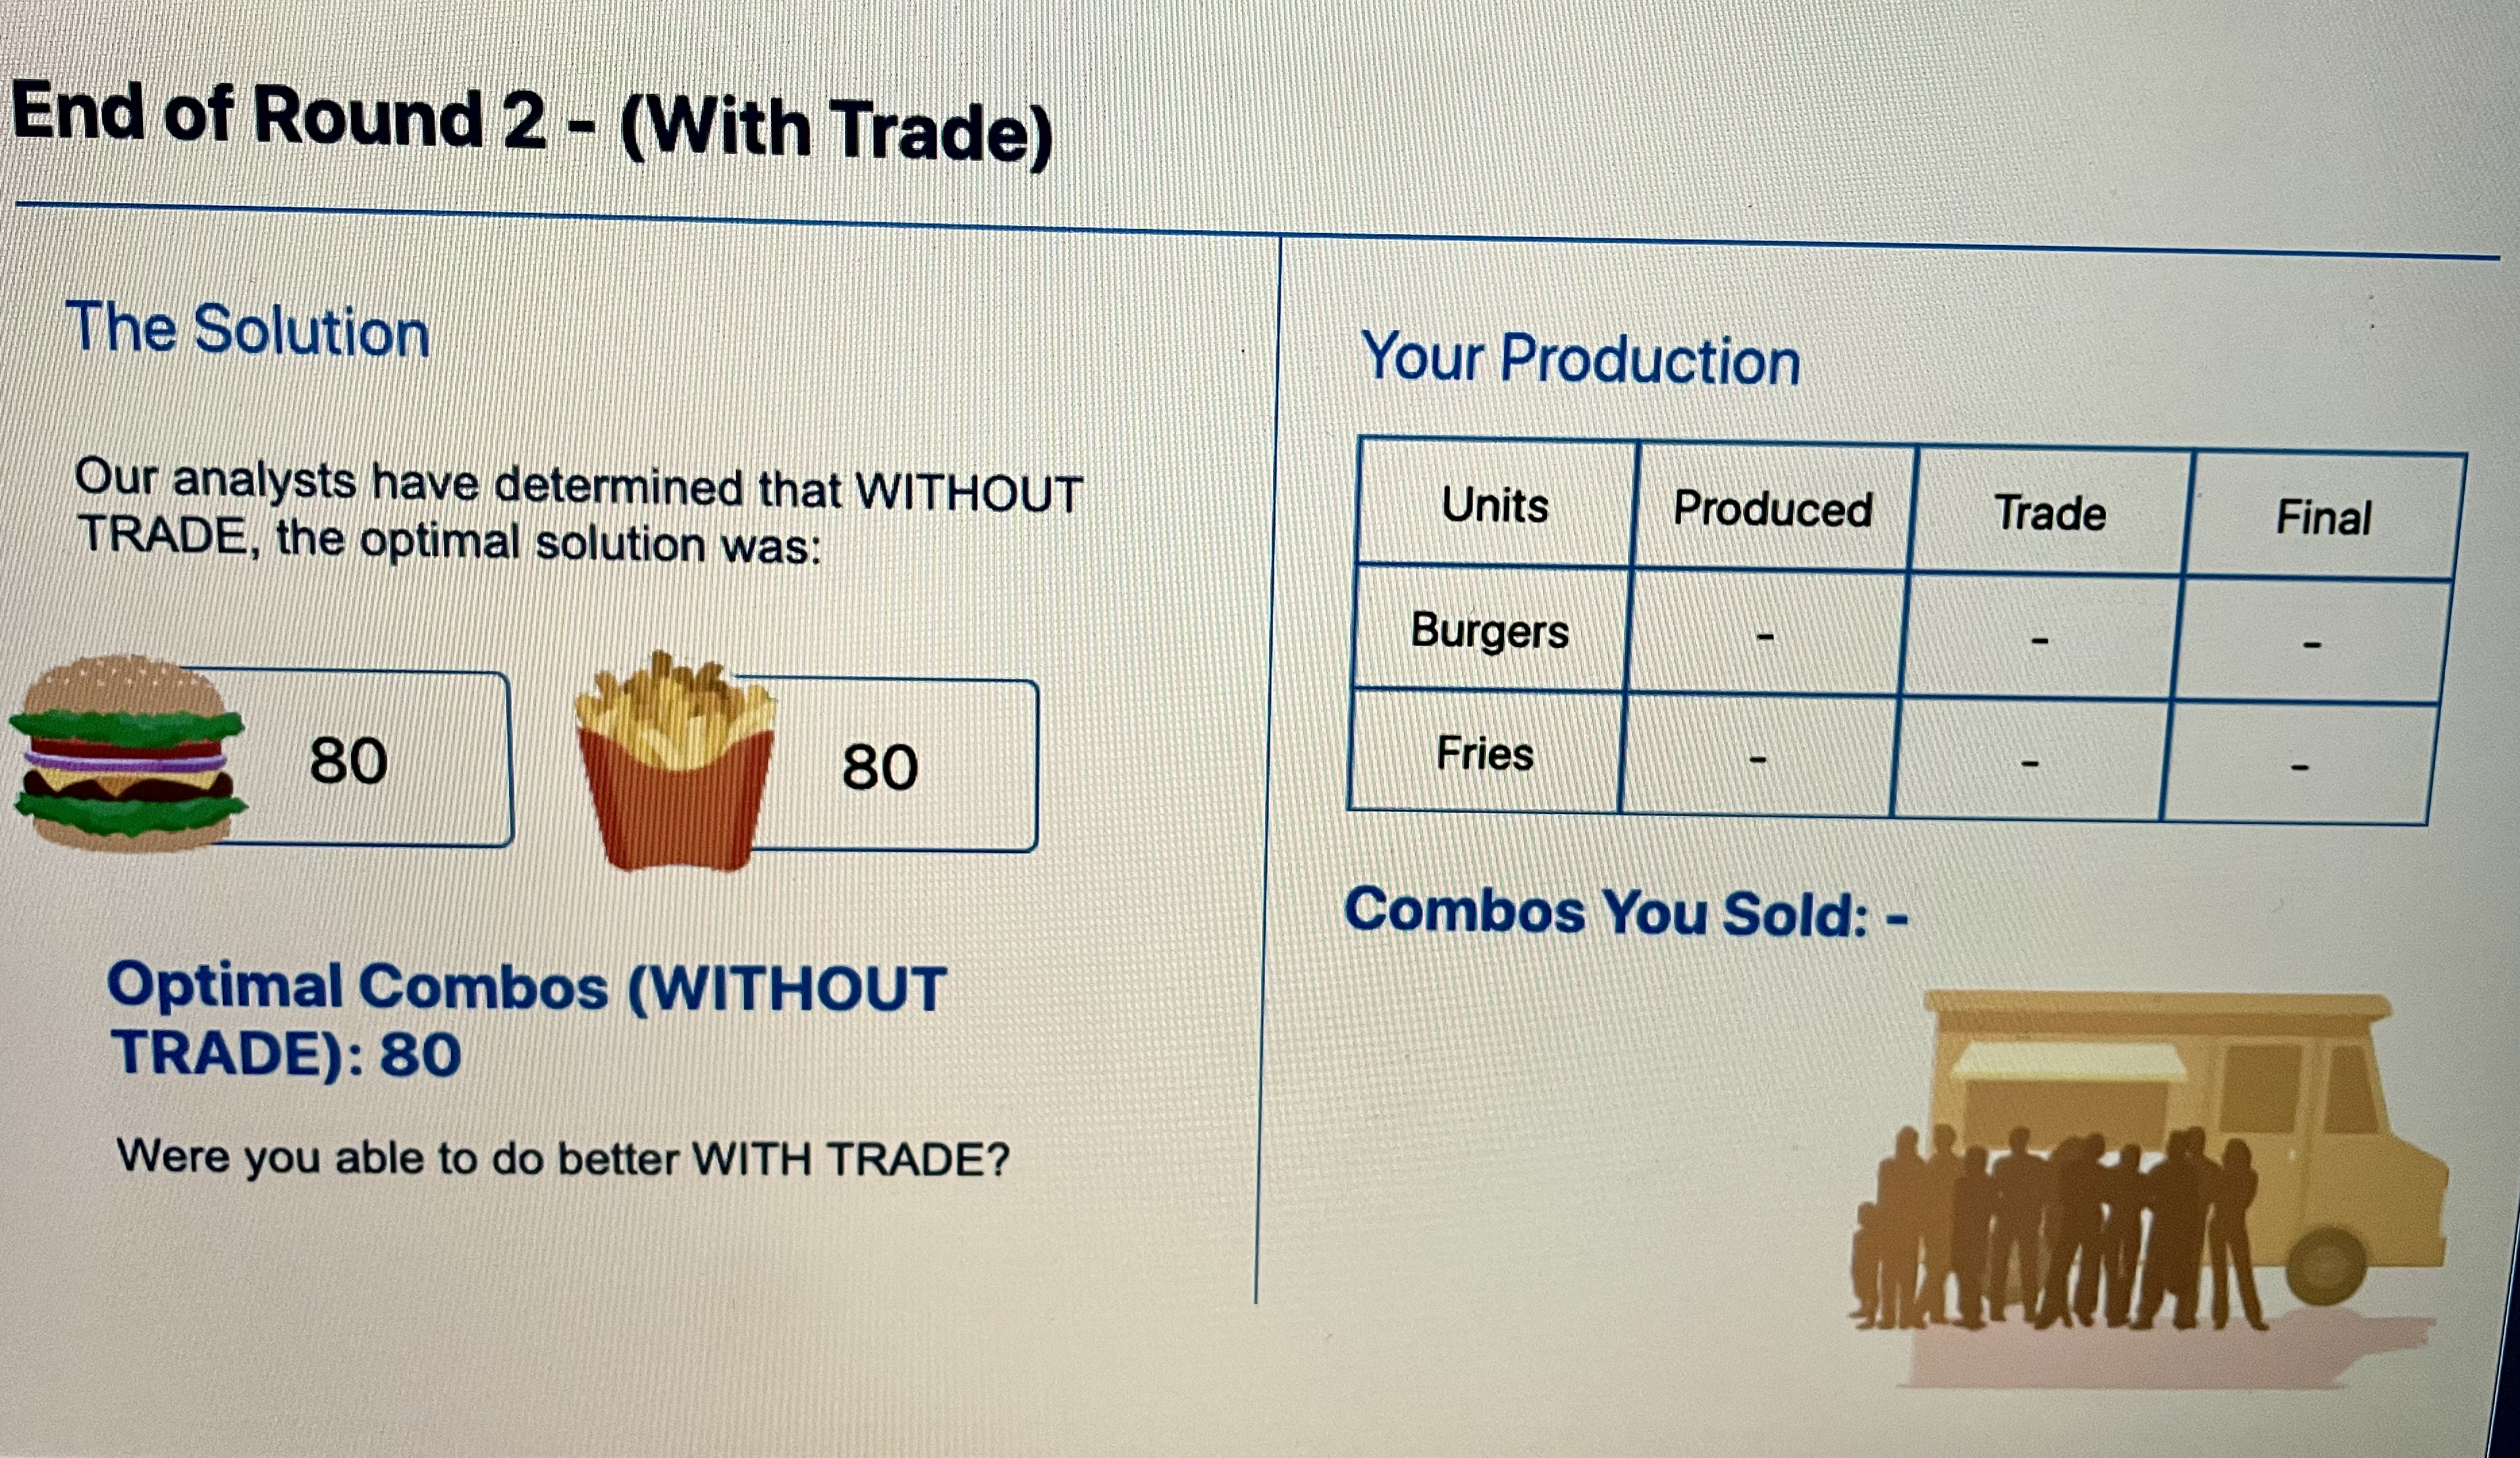
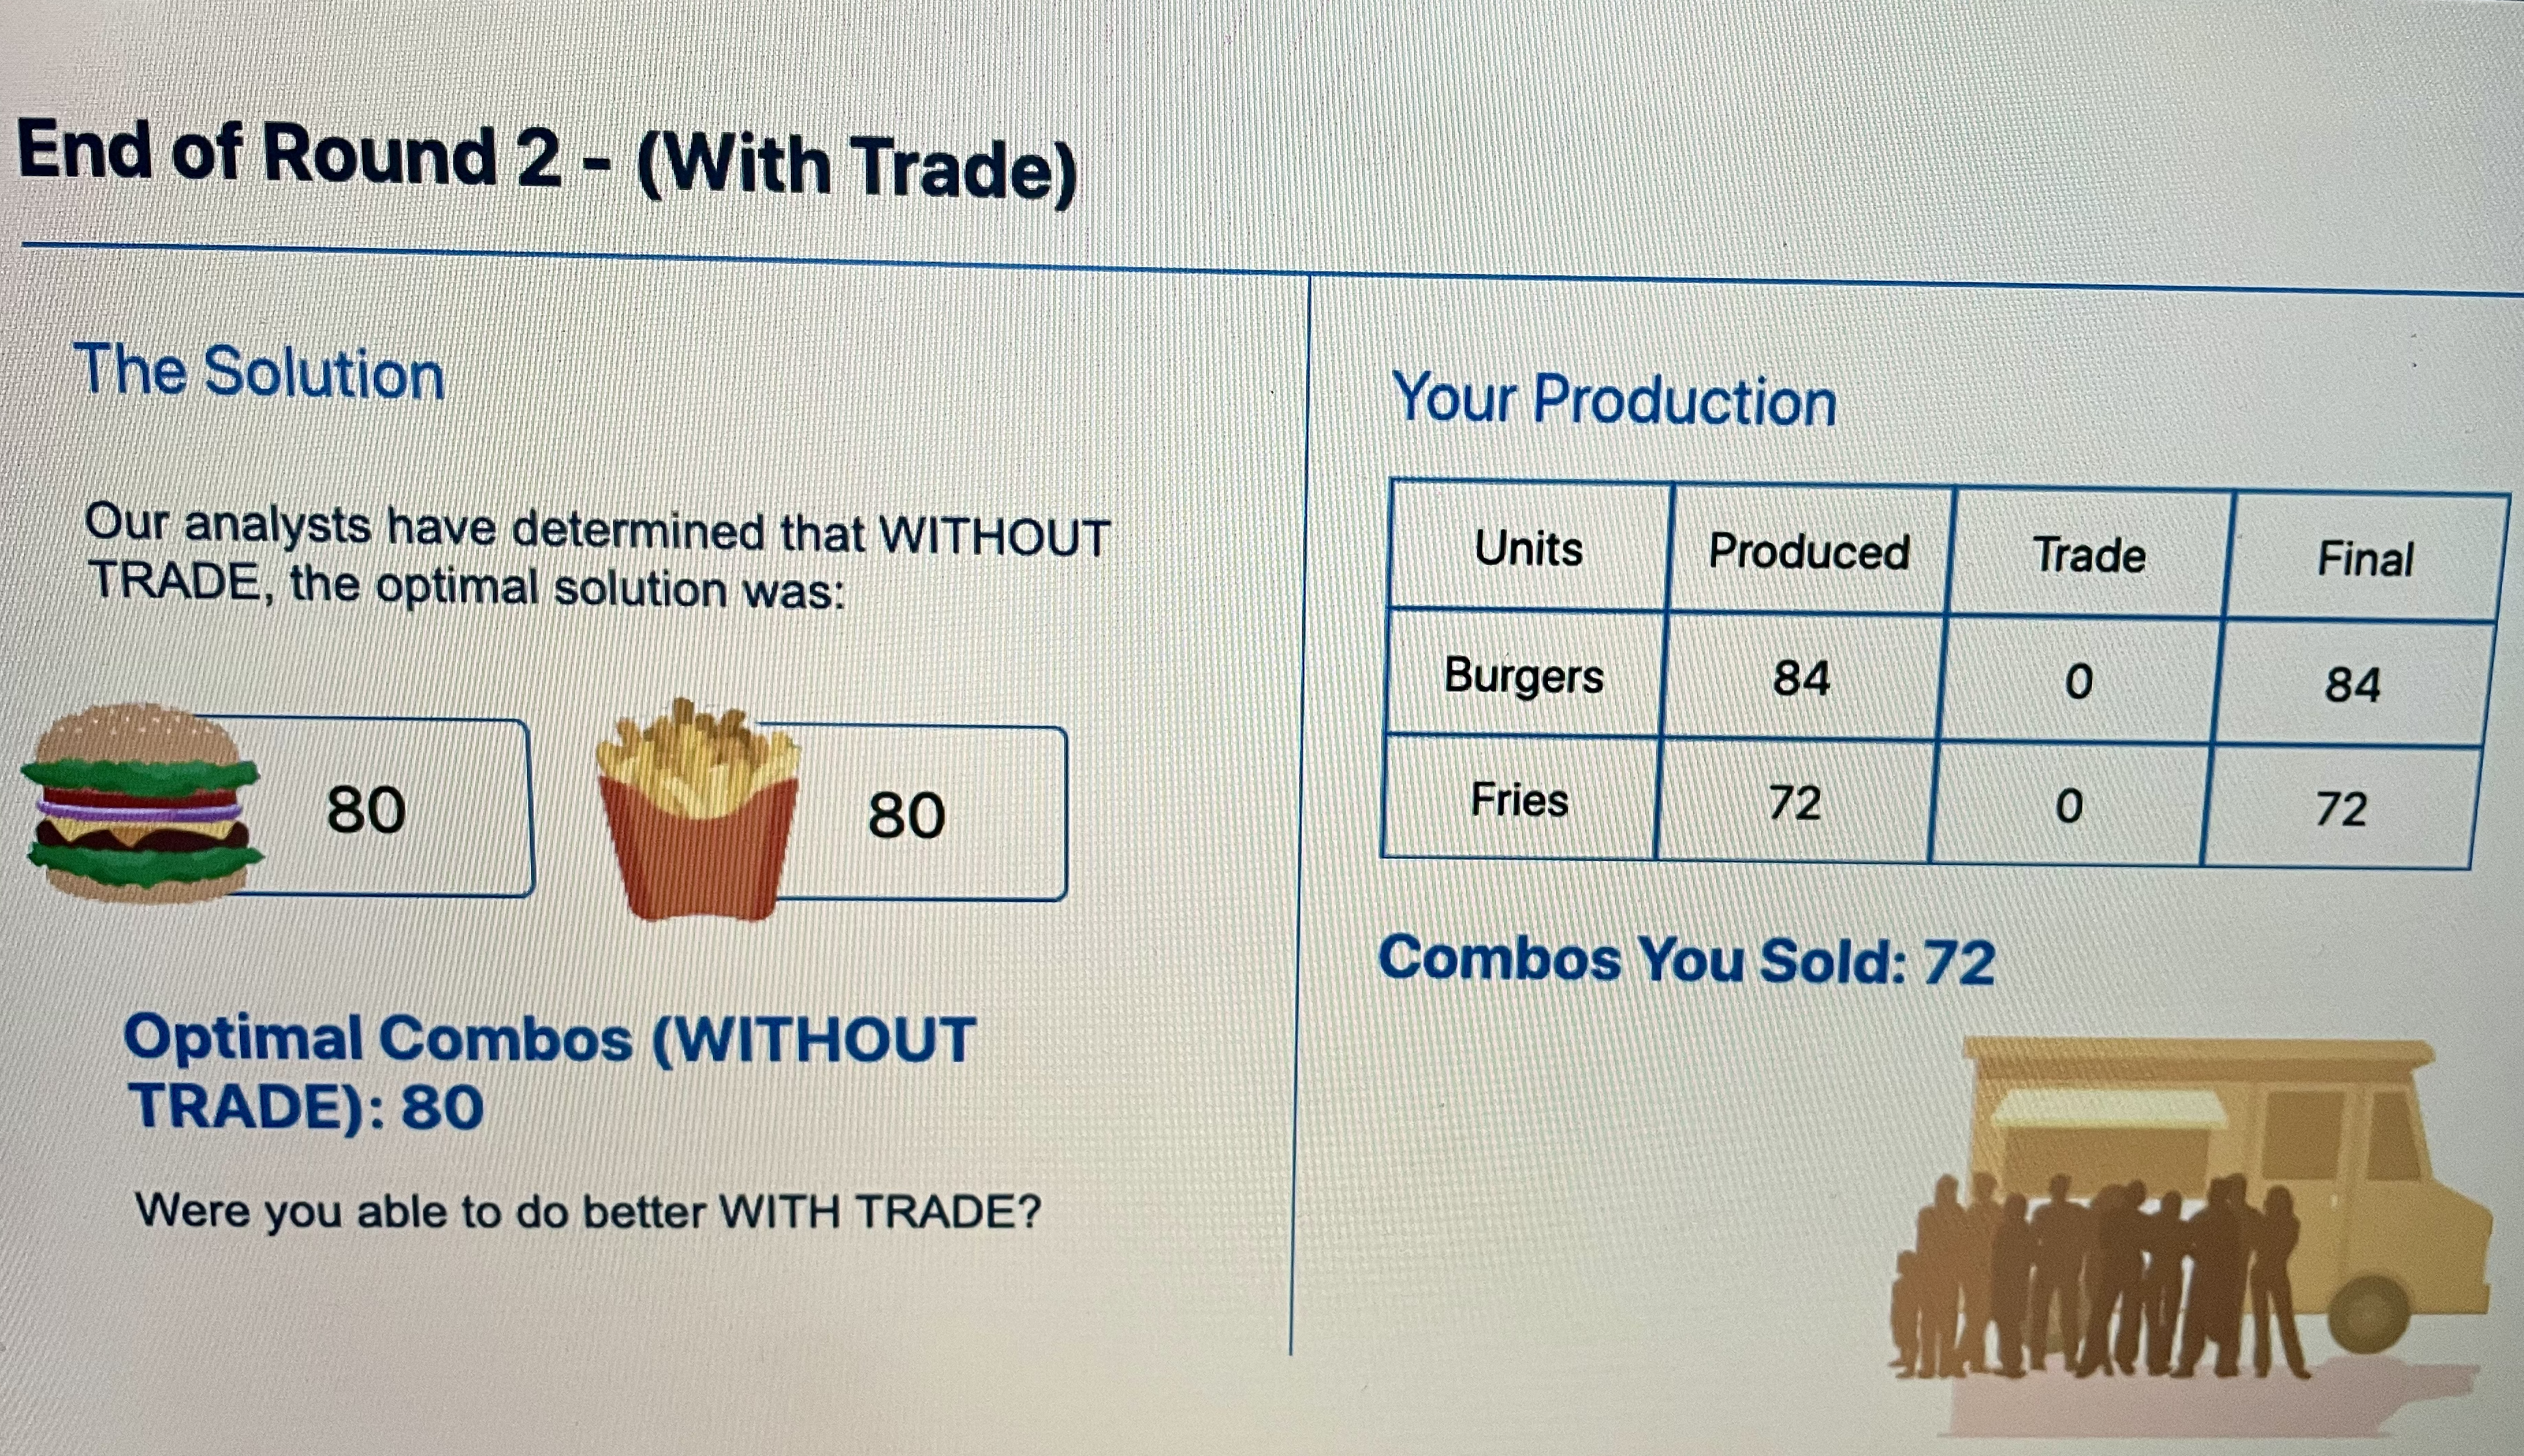
End of Round 2 - (With Trade) The Solution Our analysts have determined that WITHOUT TRADE, the optimal solution was: 80 Your Production Units Produced Trade Final Burgers 80 5 85 Fries 80 -4 76 80 Optimal Combos (WITHOUT TRADE): 80 Were you able to do better WITH TRADE? Combos You Sold: 76
Step by Step Solution
There are 3 Steps involved in it
1 Expert Approved Answer
Step: 1 Unlock

Question Has Been Solved by an Expert!
Get step-by-step solutions from verified subject matter experts
Step: 2 Unlock
Step: 3 Unlock