

Question: COMPARATIVE ANALYSIS A1 AA 12-2 Key figures for Apple and Google follow. $ millones Operating cash flows Total assets Apple Google Current Your 1 Year
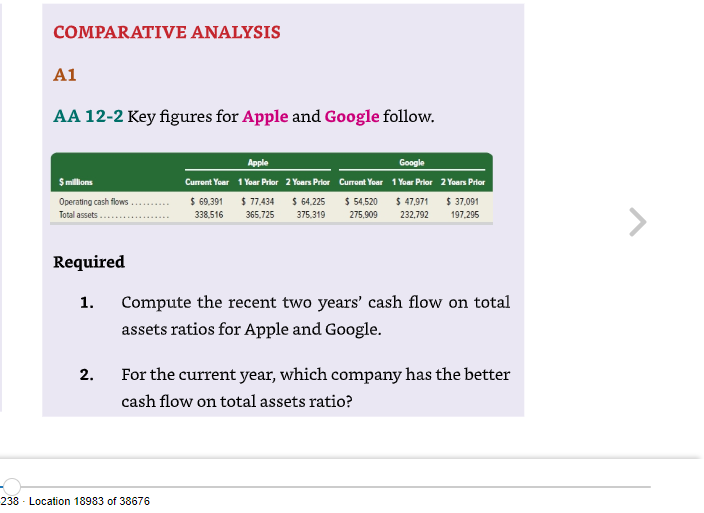
COMPARATIVE ANALYSIS A1 AA 12-2 Key figures for Apple and Google follow. $ millones Operating cash flows Total assets Apple Google Current Your 1 Year Prior 2 Years Prior Curront Yoar 1 Your Prior 2 Years Prior $ 69,391 $ 77.434 $ 64.225 $ 54,520 $ 47,971 $ 37.091 338.516 365,725 375.319 275.909 232.792 197, 295 > Required 1. Compute the recent two years' cash flow on total assets ratios for Apple and Google. 2. For the current year, which company has the better cash flow on total assets ratio? 238 - Location 18983 of 38676 3. For the current year, does cash flow on total assets outperform or underperform the industry (assumed) average of 15% for (a ) Apple and (b) Google? EXTENDED ANALYSIS
Step by Step Solution
There are 3 Steps involved in it

Get step-by-step solutions from verified subject matter experts