Question: Comparative Analysis Problem: Nestle SA (CHE) vs. Delfi Limited (SGP) CT1.2 Nestle's financial statements are presented in Appendix B. Financial statements of Delfi Lim- ited
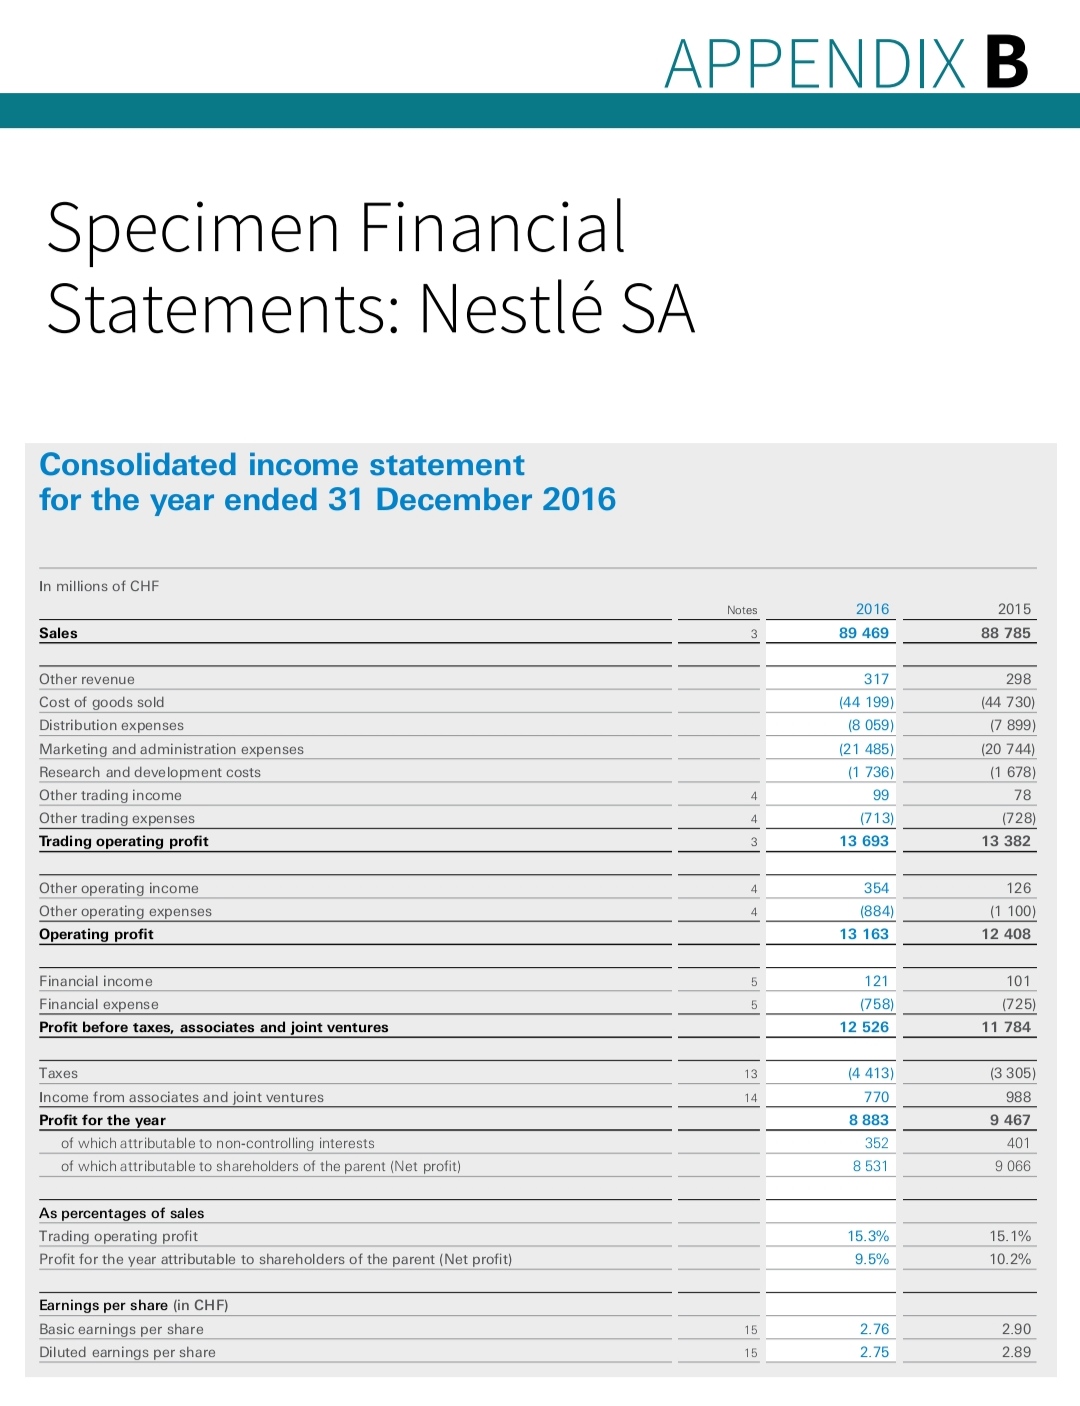
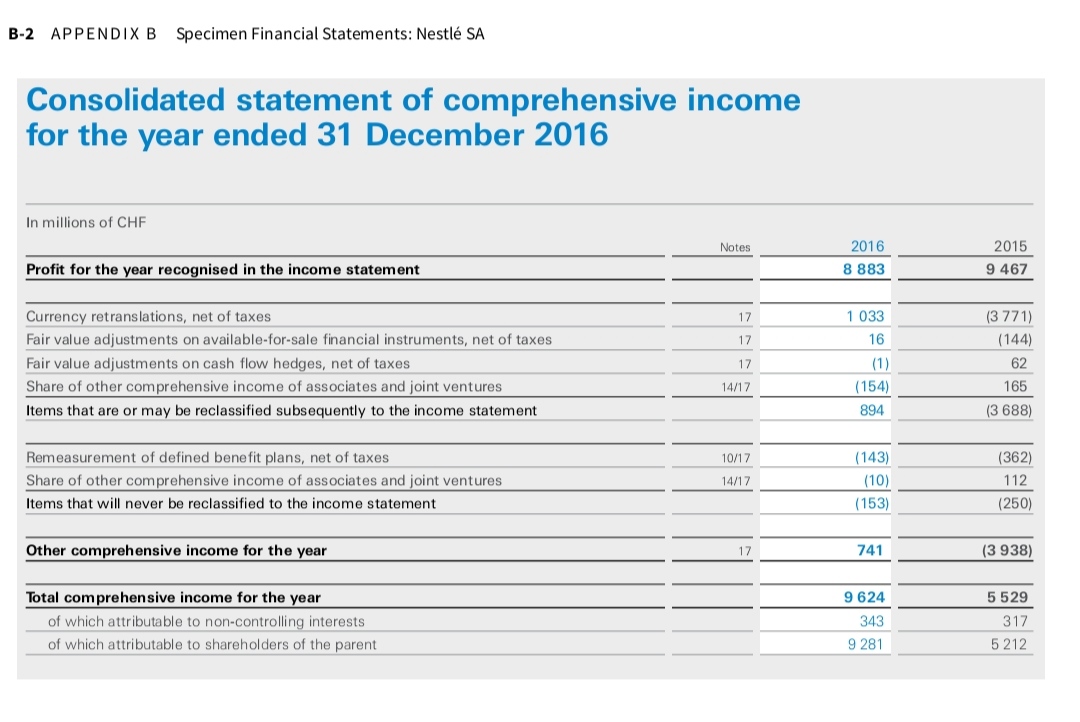
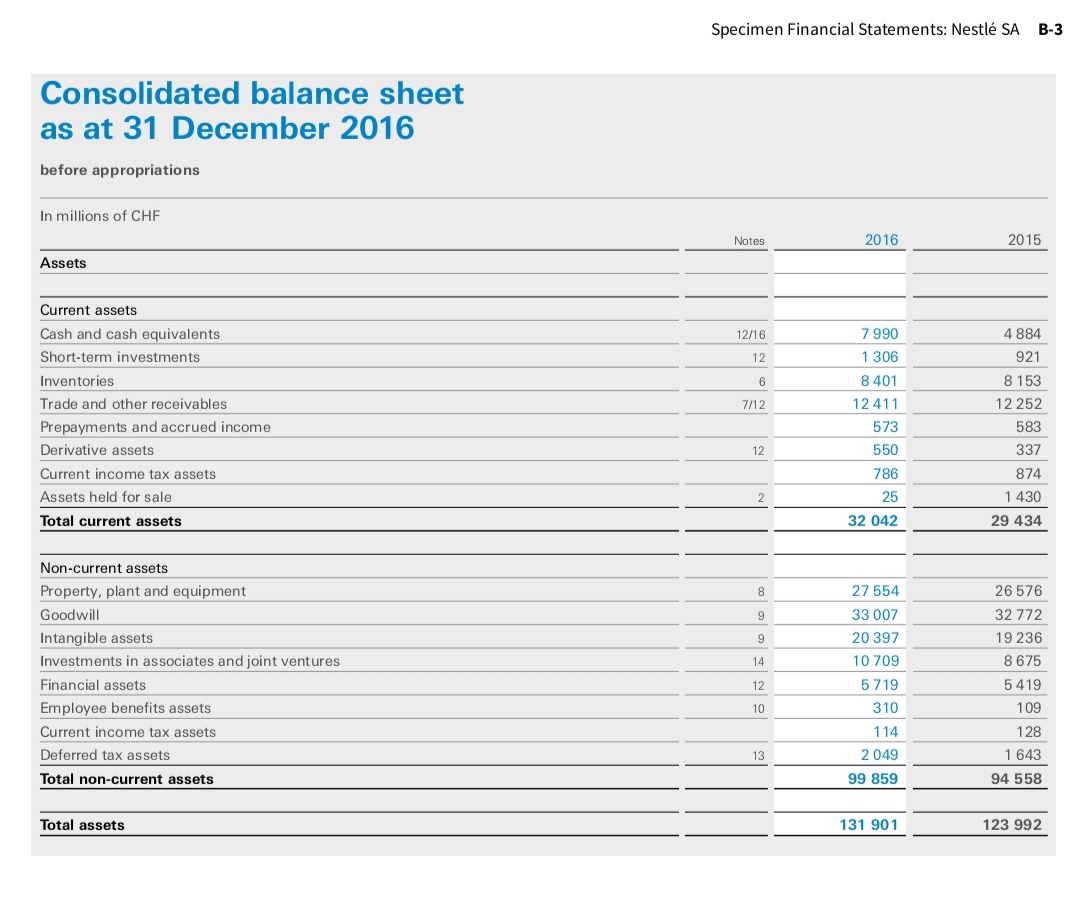
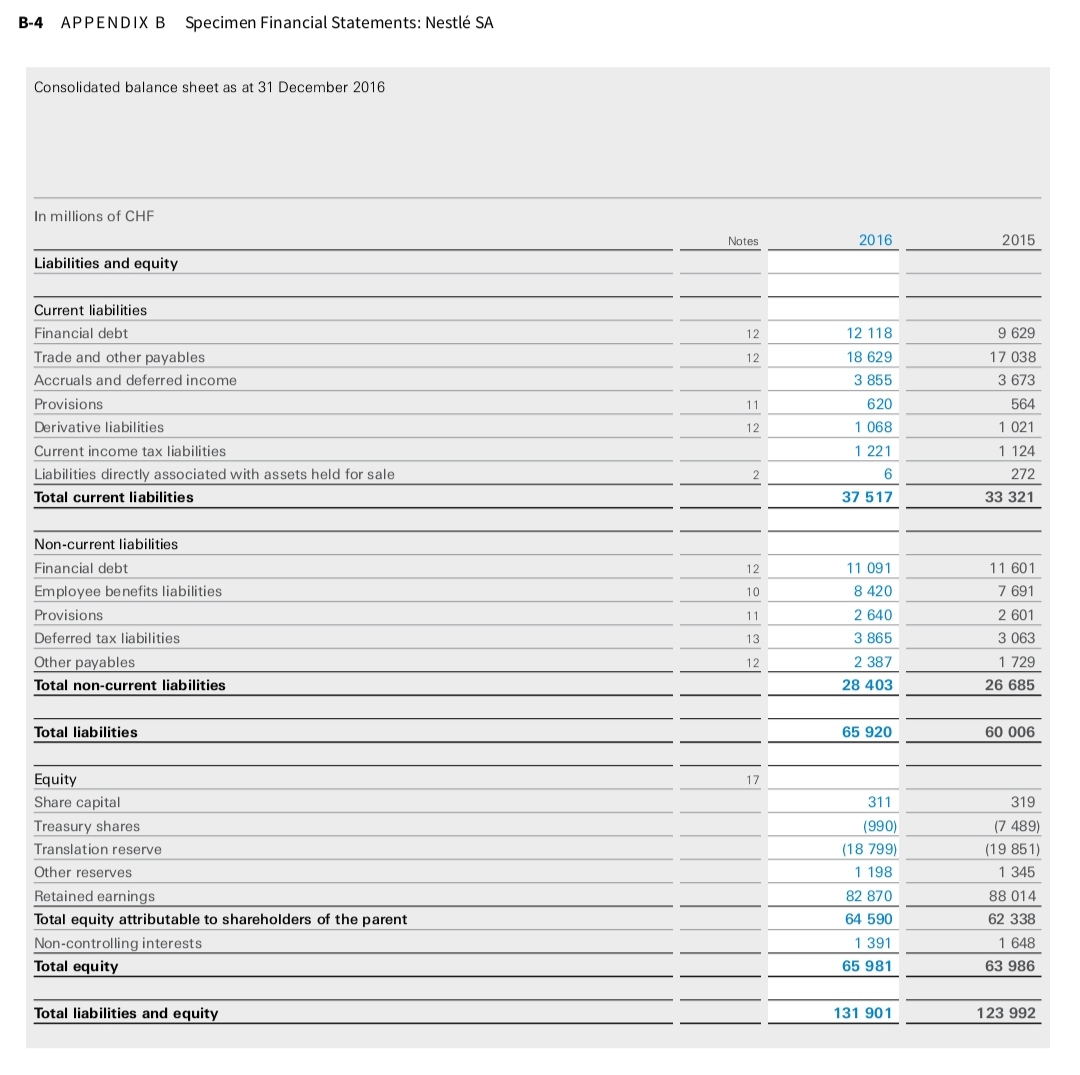
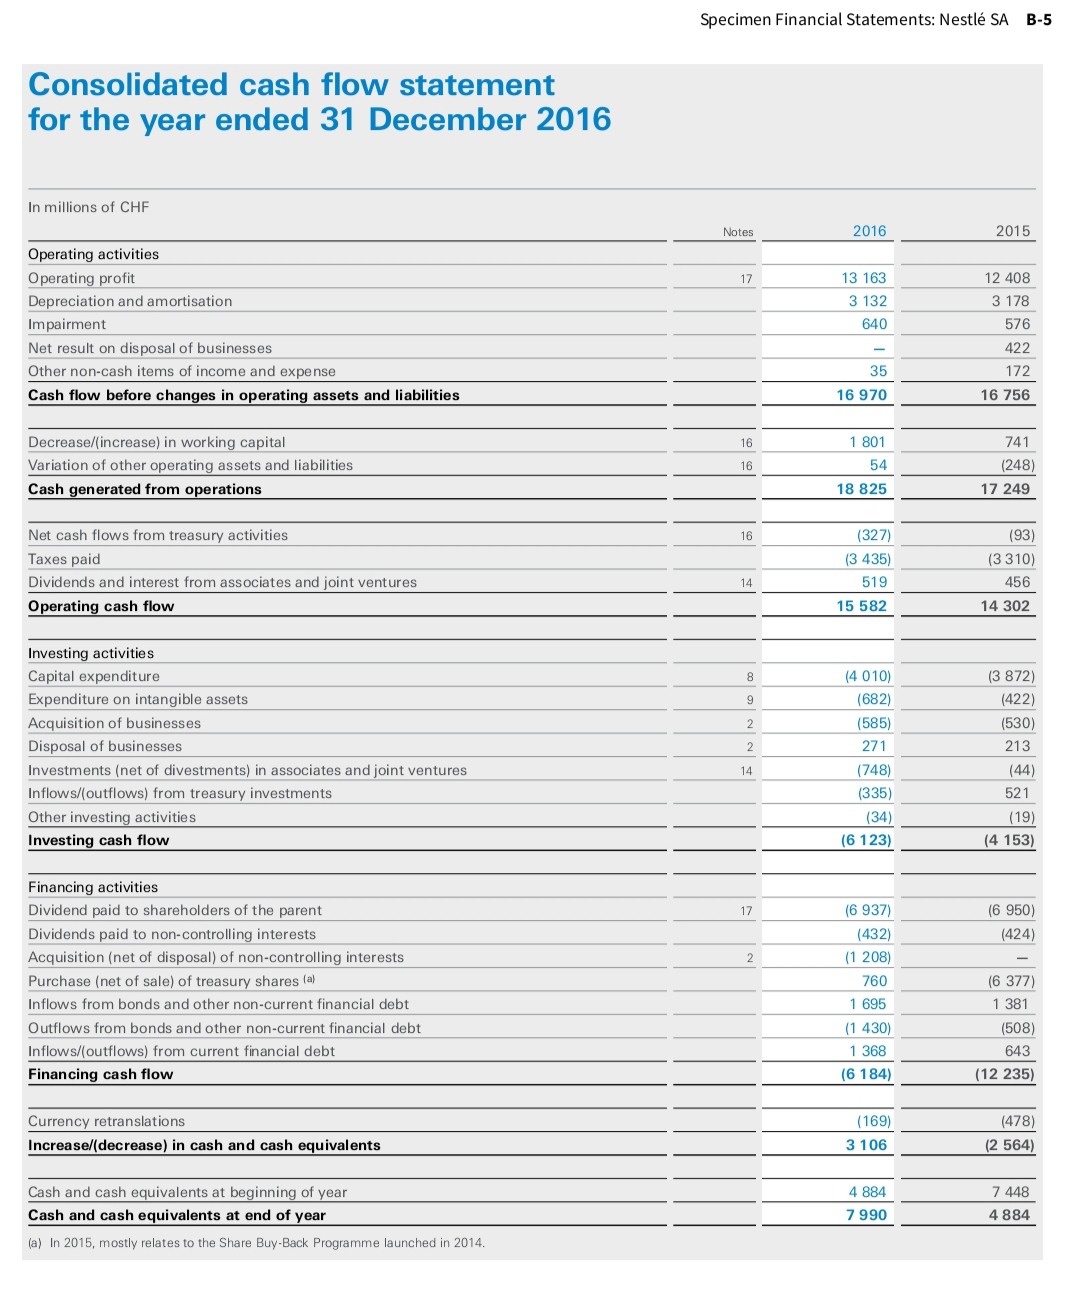
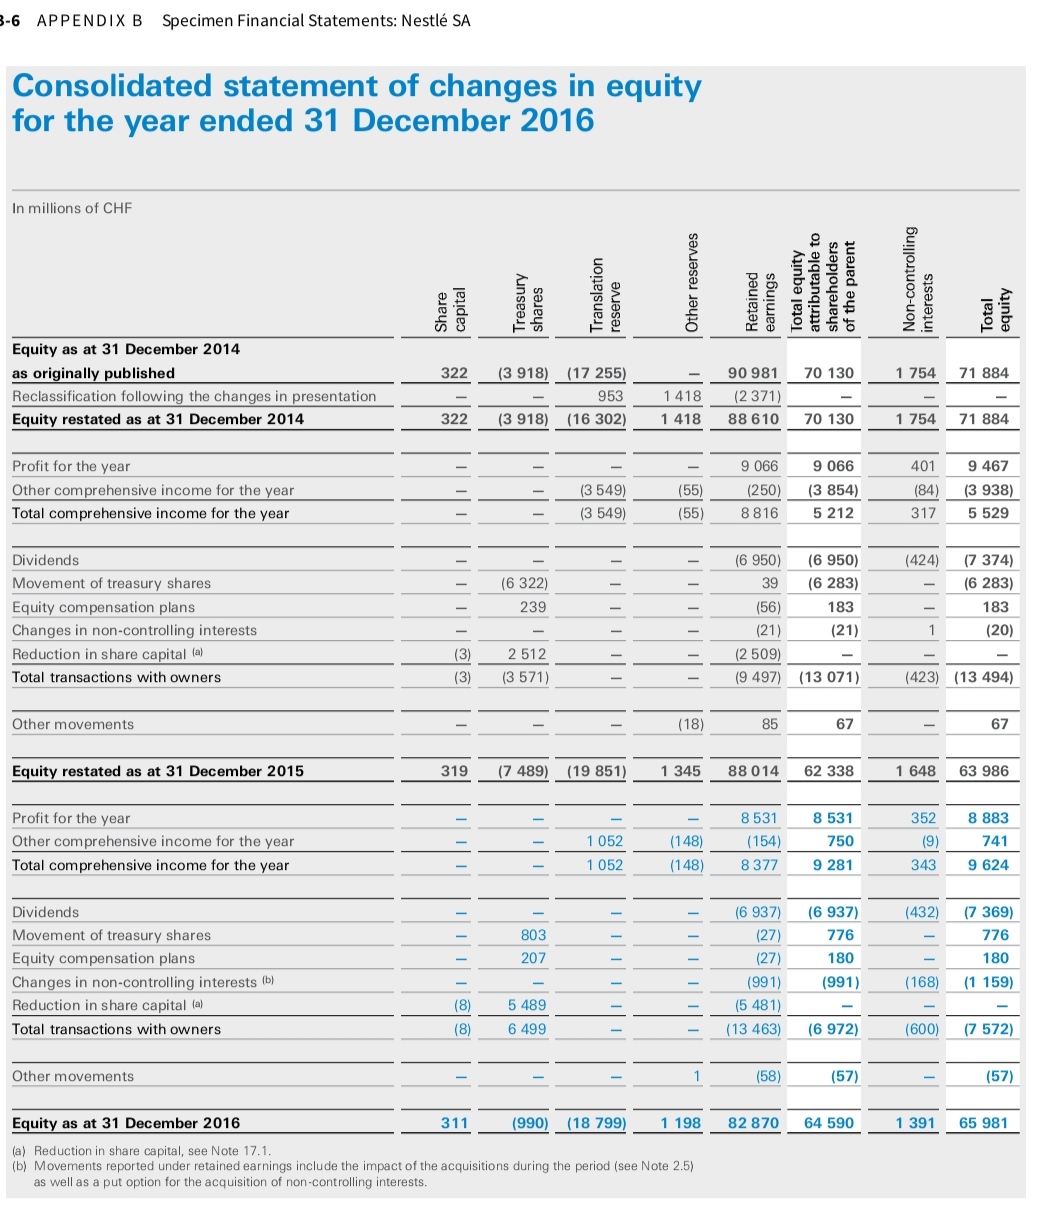
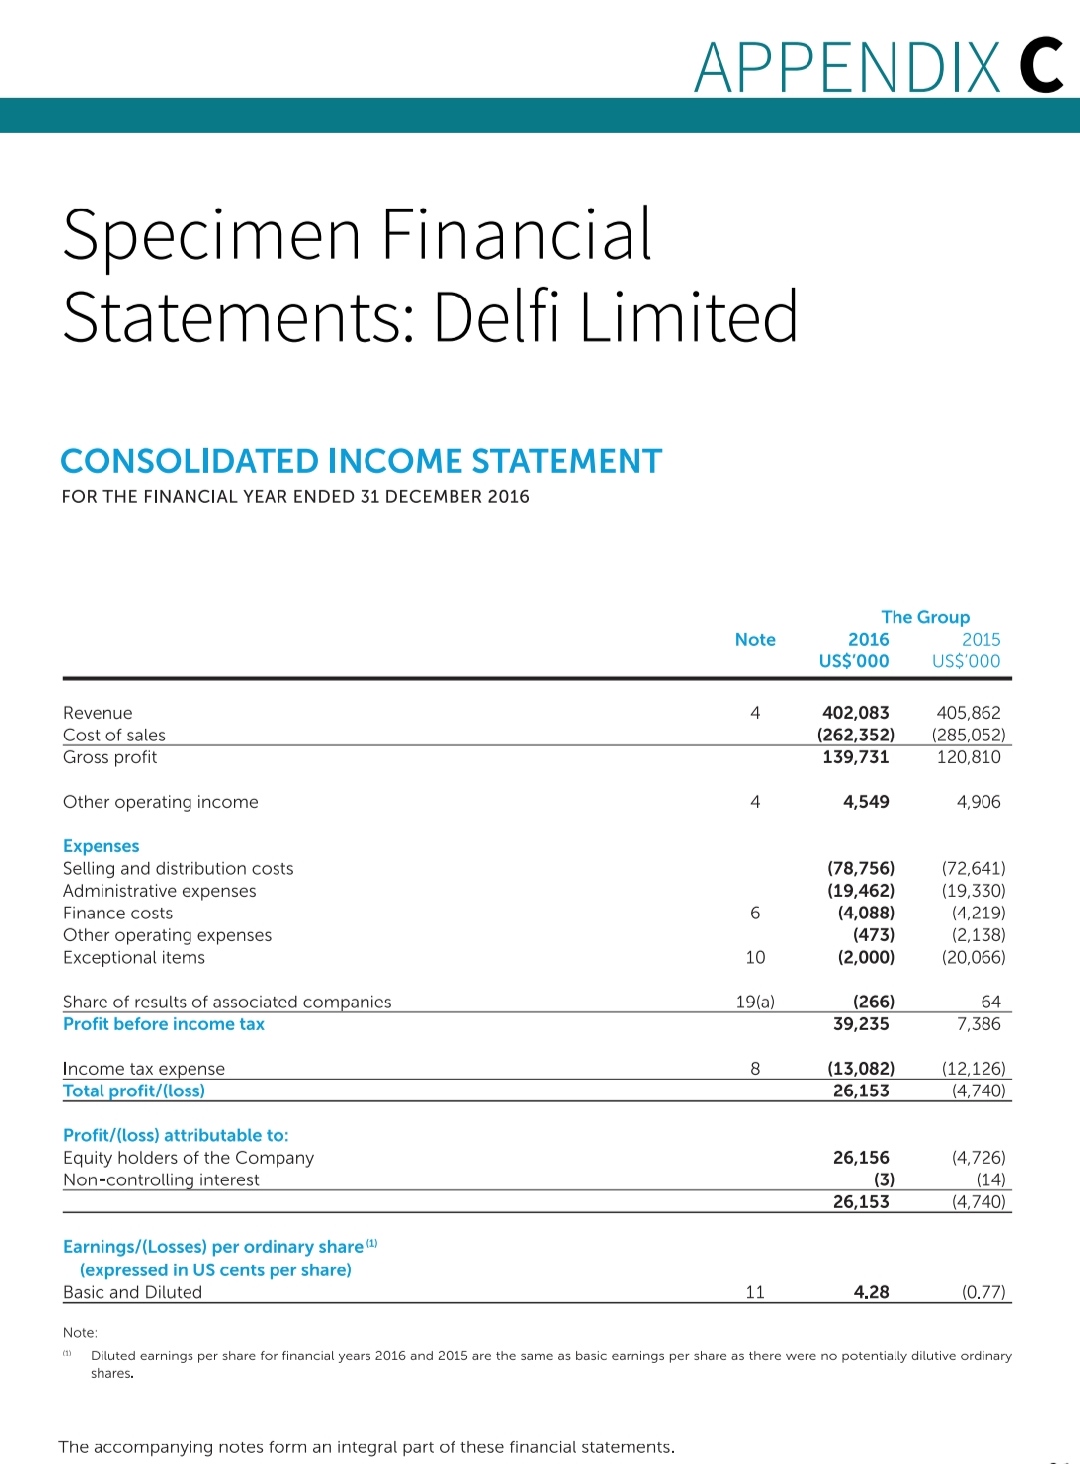
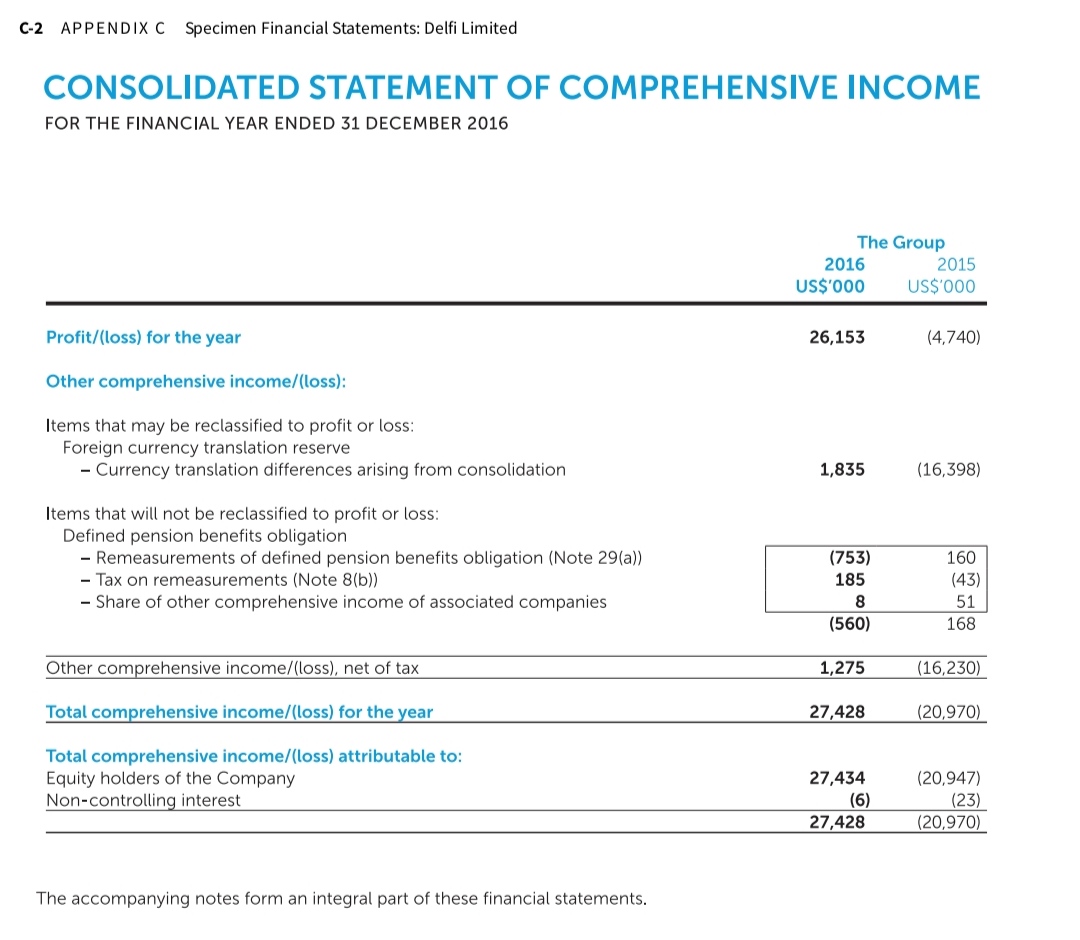
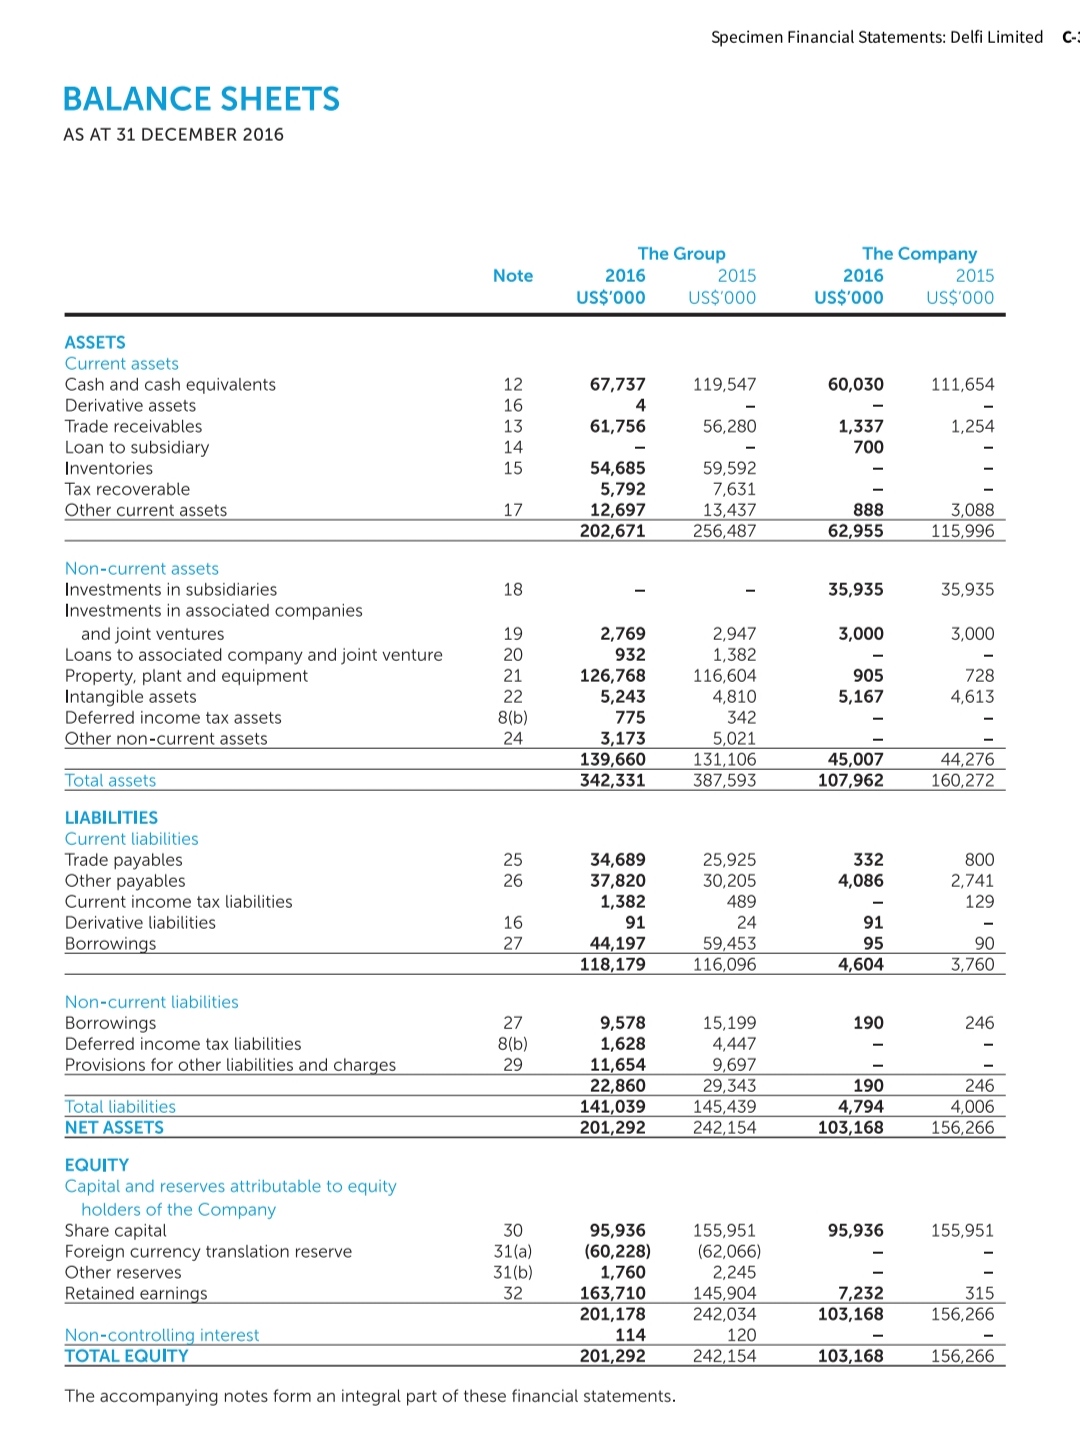
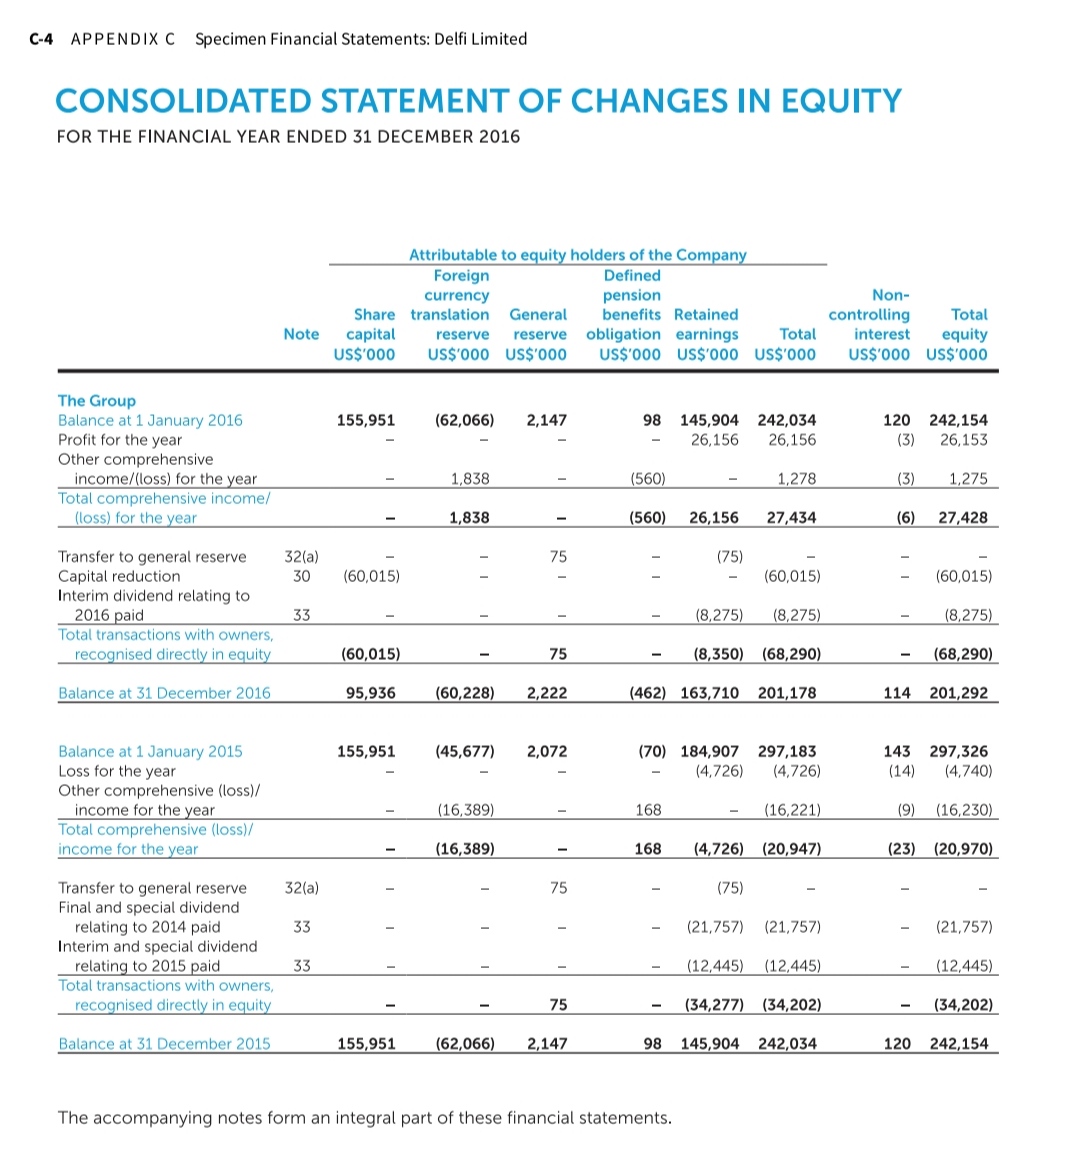
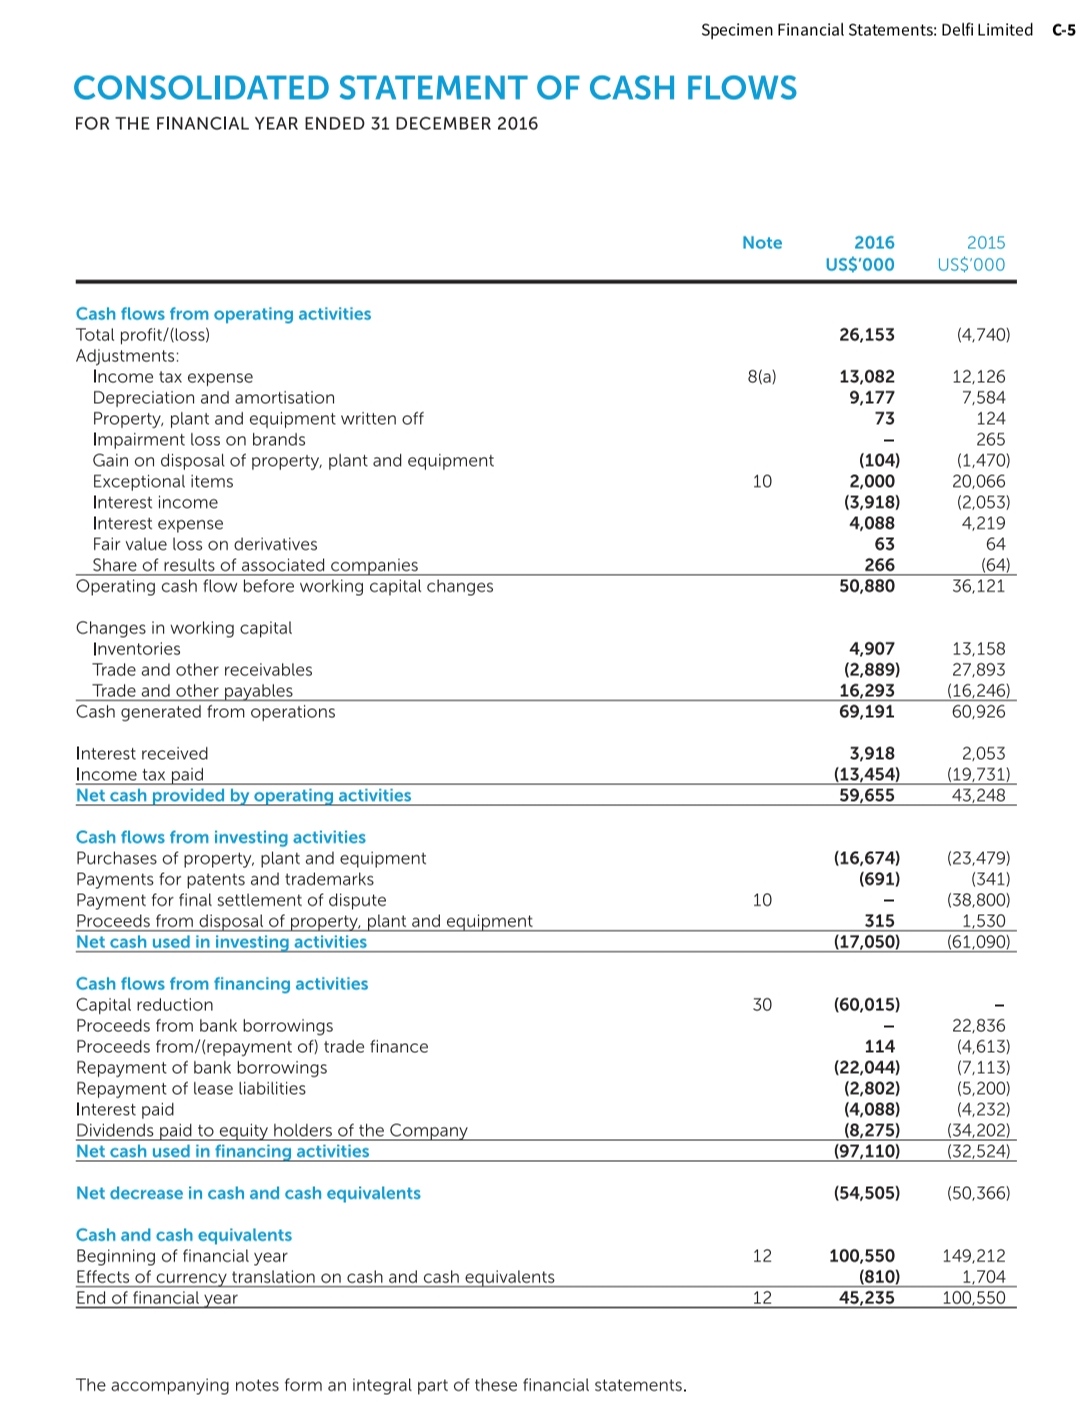
Comparative Analysis Problem: Nestle SA (CHE) vs. Delfi Limited (SGP) CT1.2 Nestle's financial statements are presented in Appendix B. Financial statements of Delfi Lim- ited are presented in Appendix C. Instructions Refer to the financial statements and answer the following questions. a. Based on the information contained in these financial statements, determine the following for each company. 1. Total assets at December 31, 2016. 2. Accounts (trade) receivable, net at December 31, 2016. 3. Net sales for year ended December 31, 2016. 4. Net income (profit) for year ended December 31, 2016. b. What percentage do receivables represent of total assets for the two companies? What percentage does net income represent of sales (revenue) for the two companies?APPENDIX B Specimen Financial Statements: Nestle SA Consolidated income statement for the year ended 31 December 2016 In millions of CHF Notes 2016 2015 Sales 89 469 88 785 Other revenue 317 298 Cost of goods sold (44 199) (44 730) Distribution expenses (8 059) (7 899) Marketing and administration expenses 21 485 (20 744) Research and development costs (1 736) (1 678) Other trading income 4 99 78 Other trading expenses 4 (713 (728) Trading operating profit 3 13 693 13 382 Other operating i 4 354 126 Other operating expenses 4 (884) (1 100) Operating profit 13 163 12 408 Financial income 121 101 Financial expense (758 (725) Profit before taxes, associates and joint ventures 12 526 11 784 Taxes 13 (4 413 (3 305) Income from associates and joint ventures 14 770 988 Profit for the year 8 883 3 467 of which attributable to non-controlling interests 352 401 of which attributable to shareholders of the parent (Net profit) 8 531 9 066 As percentages of sales Trading operating profit 15.3% 15.1% Profit for the year attributable to shareholders of the parent (Net profit) 9.5% 10.2% Earnings per share (in CHF) Basic earnings per share 15 2.76 2.90 Diluted earnings per share 15 2.75 2.89B-2 APPENDIX B Specimen Financial Statements: Nestle SA Consolidated statement of comprehensive income for the year ended 31 December 2016 In millions of CHF Notes 2016 2015 Profit for the year recognised in the income statement 8 883 9 467 Currency retranslations, net of taxes 17 1 033 (3 771) Fair value adjustments on available-for-sale financial instruments, net of taxes 17 16 (144) Fair value adjustments on cash flow hedges, net of taxes 17 (1) 62 Share of other comprehensive income of associates and joint ventures 14/17 (154) 165 Items that are or may be reclassified subsequently to the income statement 894 (3 688) Remeasurement of defined benefit plans, net of taxes 10/17 (143) (362) Share of other comprehensive income of associates and joint ventures 14/17 (10) 112 Items that will never be reclassified to the income statement 153) (250) Other comprehensive income for the year 17 741 (3938) Total comprehensive income for the year 9 624 5 529 of which attributable to non-controlling interests 343 317 of which attributable to shareholders of the parent 9 281 5 212Specimen Financial Statements: Nestle SA B-3 Consolidated balance sheet as at 31 December 2016 before appropriations In millions of CHF Notes 2016 2015 Assets Current assets Cash and cash equivalents 12/16 7 990 4 884 Short-term investments 12 1 306 921 Inventories 6 8 401 8 153 Trade and other receivables 7/12 12 411 12 252 Prepayments and accrued income 573 583 Derivative assets 12 550 337 Current income tax assets 786 874 Assets held for sale 2 25 1 430 Total current assets 32 042 29 434 Non-current assets Property, plant and equipment 8 27 554 26 576 Goodwill 9 33 007 32 772 Intangible assets 9 20 397 19 236 Investments in associates and joint ventures 14 10 709 8 675 Financial assets 12 5 719 5419 Employee benefits assets 10 310 109 Current income tax assets 114 128 Deferred tax assets 13 2 049 1 643 Total non-current assets 99 859 94 558 Total assets 131 901 123 992B-4 APPENDIX B Specimen Financial Statements: Nestle SA Consolidated balance sheet as at 31 December 2016 In millions of CHF Notes 2016 2015 Liabilities and equity Current liabilities Financial debt 12 12 118 9 629 Trade and other payables 12 18 629 17 038 Accruals and deferred income 3 855 3 673 Provisions 11 620 564 Derivative liabilities 12 1 068 1 021 Current income tax liabilities 1 221 1 124 Liabilities directly associated with assets held for sale 2 6 272 Total current liabilities 37 517 33 321 Non-current liabilities Financial debt 12 11 091 11 601 Employee benefits liabilities 10 8 420 7 691 Provisions 11 2 640 2 601 Deferred tax liabilities 13 3 865 3 063 Other payables 12 2 387 729 Total non-current liabilities 28 403 26 685 Total liabilities 65 920 60 006 Equity 17 Share capital 311 319 Treasury shares (990) (7 489) Translation reserve (18 799) (19 851) Other reserves 1 198 1 345 Retained earnings 82 870 88 014 Total equity attributable to shareholders of the parent 64 590 52 338 Non-controlling interests 1 391 648 Total equity 65 981 63 986 Total liabilities and equity 131 901 123 992Specimen Financial Statements: Nestle SA B-5 Consolidated cash flow statement for the year ended 31 December 2016 In millions of CHF Notes 2016 2015 Operating activities Operating profit 17 13 163 12 408 Depreciation and amortisation 3 132 3 178 Impairment 640 576 Net result on disposal of businesses 422 Other non-cash items of income and expense 35 172 Cash flow before changes in operating assets and liabilities 16 970 16 756 Decrease/(increase) in working capital 16 1 801 741 Variation of other operating assets and liabilities 16 54 248) Cash generated from operations 18 825 17 249 Net cash flows from treasury activities 16 (327) (93) Taxes paid (3 435) (3 310) Dividends and interest from associates and joint ventures 14 519 456 Operating cash flow 15 582 14 302 Investing activities Capital expenditure (4 010) 3 872) Expenditure on intangible assets (682) (422) Acquisition of businesses 2 (585) (530) Disposal of businesses 2 271 213 Investments (net of divestments) in associates and joint ventures 14 (748) (44) Inflows/(outflows) from treasury investments 335 521 Other investing activities (34) (19) Investing cash flow 6 123) (4 153) Financing activities Dividend paid to shareholders of the parent 17 (6 937) (6 950) Dividends paid to non-controlling interests (432) (424) Acquisition (net of disposal) of non-controlling interests 2 (1 208) Purchase (net of sale) of treasury shares (a) 760 (6 377) Inflows from bonds and other non-current financial debt 1 695 1 381 Outflows from bonds and other non-current financial debt (1 430) (508) Inflows/(outflows) from current financial debt 1 368 643 Financing cash flow 6 184) 12 235) Currency retranslations (169) (478) Increase/(decrease) in cash and cash equivalents 3 106 (2 564) Cash and cash equivalents at beginning of year 4 884 7 448 Cash and cash equivalents at end of year 7990 4884 (a) In 2015, mostly relates to the Share Buy-Back Programme launched in 2014.-6 APPENDIX B Specimen Financial Statements: Nestle SA Consolidated statement of changes in equity for the year ended 31 December 2016 In millions of CHF Non-controlling attributable to Other reserves of the parent shareholders Total equity Translation Retained interests earnings Treasury shares reserve capital equity Share Total Equity as at 31 December 2014 as originally published 322 (3 918) (17 255) 90 981 70 130 1 754 71 884 Reclassification following the changes in presentation 95 1418 2 371) Equity restated as at 31 December 2014 322 (3 918) (16 302) 1 418 88 610 70 130 1 754 71 884 Profit for the year 9 066 9 066 401 9 467 - 1 I Other comprehensive income for the year (3 549) (55) (250) 3 854) (84) (3 938) Total comprehensive income for the year - - (3 549) (55) 8 816 5 212 317 5 529 Dividends - (6 950) (6 950) (424) (7 374) Movement of treasury shares - (6 322) - 39 (6 283) (6 283) Equity compensation plans 239 - (56 183 183 Changes in non-controlling interests - (21 ) (21) (20) Reduction in share capital (a) (3) 2 512 - (2 509) Total transactions with owners (3) (3 571 ) - - (9 497) (13 071) (423) (13 494) Other movements - (18) 85 67 67 Equity restated as at 31 December 2015 319 (7 489) (19 851 1 345 88 014 62 338 1 648 63 986 Profit for the year 8 531 8 531 352 8 883 Other comprehensive income for the year - 1 052 148 (154) 750 (9) 741 Total comprehensive income for the year - - 1 052 148 8 377 3 281 343 9 624 Dividends (6 937) (6 937) (432) (7 369) Movement of treasury shares - 803 - (27 776 776 Equity compensation plans 207 - - (27) 180 180 Changes in non-controlling interests (b) - - - (991) (991) (168) (1 159) Reduction in share capital (a) (8) 5 489 - (5 481) Total transactions with owners (8) 6 499 (13 463) (6 972) (600) (7 572) Other movements - (58) (57) (57) Equity as at 31 December 2016 311 (990) (18 799 1 198 82 870 64 590 1 391 65 981 (a) Reduction in share capital, see Note 17.1. (b) Movements reported under retained earnings include the impact of the acquisitions during the period (see Note 2.5) as well as a put option for the acquisition of non-controlling interests.APPENDIX C Specimen Financial Statements: Delfi Limited CONSOLIDATED INCOME STATEMENT FOR THE FINANCIAL YEAR ENDED 31 DECEMBER 2016 The Group Note 2016 2015 US$'000 US$'000 Revenue 4 402,083 405,852 Cost of sales (262,352) (285,052) Gross profit 139,731 120,810 Other operating income 4 4,549 4,906 Expenses Selling and distribution costs (78,756) (72,641) Administrative expenses (19,462) (19,330) Finance costs 6 (4,088) (1,219) Other operating expenses (473) (2,138) Exceptional items 10 (2,000) (20,056) Share of results of associated companies 19(a) (266) 64 Profit before income tax 39,235 7,386 Income tax expense 8 (13,082) (12,126) Total profit/(loss) 26,153 (4.740) Profit/(loss) attributable to: Equity holders of the Company 26,156 (4,726) Non-controlling interest (3) 14) 26,153 (4,740) Earnings/(Losses) per ordinary share(1) (expressed in US cents per share) Basic and Diluted 11 4.28 (0.77) Note: Diluted earnings per share for financial years 2016 and 2015 are the same as basic earnings per share as there were no potentially dilutive ordinary shares. The accompanying notes form an integral part of these financial statements.C-2 APPENDIX C Specimen Financial Statements: Delfi Limited CONSOLIDATED STATEMENT OF COMPREHENSIVE INCOME FOR THE FINANCIAL YEAR ENDED 31 DECEMBER 2016 The Group 2016 2015 US$'000 US$'000 Profit/(loss) for the year 26,153 (4,740) Other comprehensive income/(loss): Items that may be reclassified to profit or loss: Foreign currency translation reserve - Currency translation differences arising from consolidation 1,835 (16,398) Items that will not be reclassified to profit or loss: Defined pension benefits obligation - Remeasurements of defined pension benefits obligation (Note 29(a)) (753) 160 - Tax on remeasurements (Note 8(b)) 185 (43) - Share of other comprehensive income of associated companies 8 51 (560) 168 Other comprehensive income/(loss), net of tax 1,275 (16,230) Total comprehensive income/(loss) for the year 27,428 (20,970) Total comprehensive income/(loss) attributable to: Equity holders of the Company 27,434 (20,947) Non-controlling interest (6) (23 ) 27,428 (20,970) The accompanying notes form an integral part of these financial statements.Specimen Financial Statements: Delfi Limited C- BALANCE SHEETS AS AT 31 DECEMBER 2016 The Group The Company Note 2016 2015 2016 2015 US$'000 US$'000 US$'000 US$'000 ASSETS Current assets Cash and cash equivalents 12 67,737 119,547 60,030 111,654 Derivative assets 16 Trade receivables 13 61,756 56,280 1,337 1,254 Loan to subsidiary 14 700 Inventories 15 54,685 59,592 Tax recoverable 5,792 7,631 Other current assets 17 12,697 13,437 888 3,088 202,671 256,487 62,955 115,996 Non-current assets Investments in subsidiaries 18 35,935 35,935 nvestments in associated companies and joint ventures 19 2,769 2,947 3,000 3,000 Loans to associated company and joint venture 20 932 1,382 Property, plant and equipment 21 126,768 116,604 905 728 Intangible assets 22 5,243 4,810 5,167 4,613 Deferred income tax assets 8(b 775 342 Other non-current assets 24 3,173 5,021 39,660 131,106 45,007 44,276 Total assets 342,331 387,593 107,962 160,272 LIABILITIES Current liabilities Trade payables 25 34,689 25,925 332 800 Other payables 26 37,820 30,205 4,086 2,741 Current income tax liabilities 1,382 489 129 Derivative liabilities 16 91 24 91 Borrowings 27 44,197 59,453 95 90 118,179 116,096 4,604 3,760 Non-current liabilities Borrowings 27 9,578 15,199 190 246 Deferred income tax liabilities 8 (b) 1,628 4,447 Provisions for other liabilities and charges 29 11,654 9,697 22,860 29,343 190 246 Total liabilities 141,039 145,439 4,794 4,006 NET ASSETS 201,292 242,154 103,168 156,266 EQUITY Capital and reserves attributable to equity holders of the Company Share capital 30 95,936 155,951 95,936 155,951 Foreign currency translation reserve 31(a) (60,228) (62,066) Other reserves 31 (b ) 1,760 2,245 Retained earnings 32 163,710 145,904 7,232 315 201,178 242,034 103,168 156,266 Non-controlling interest 114 120 TOTAL EQUITY 201,292 242,154 103,168 156,266 The accompanying notes form an integral part of these financial statements.C-4 APPENDIX C Specimen Financial Statements: Delfi Limited CONSOLIDATED STATEMENT OF CHANGES IN EQUITY FOR THE FINANCIAL YEAR ENDED 31 DECEMBER 2016 Attributable to equity holders of the Company Foreign Defined currency pension Non- Share translation General benefits Retained controlling Total Note capital reserve reserve obligation earnings Total interest equity US$'000 US$'000 US$'000 US$'000 US$'000 US$'000 US$'000 US$'000 The Group Balance at 1 January 2016 155,951 (62,066) 2,147 98 145,904 242,034 120 242,154 Profit for the year 26,156 26,156 (3) 26,153 Other comprehensive income/(loss) for the year 1,838 (560) 1,278 (3) 1,275 Total comprehensive income (loss) for the year 1,838 (560) 26,156 27,434 (6) 27,428 Transfer to general reserve 32(a) 75 (75) Capital reduction 30 (60,015) (60,015) (60,015) Interim dividend relating to 2016 paid 33 (8,275) (8,275) (8,275) Total transactions with owners, recognised directly in equity (60,015) 75 (8,350) (68,290) (68,290) Balance at 31 December 2016 95,936 (60,228) 2,222 (462) 163,710 201,178 114 201,292 Balance at 1 January 2015 155,951 (45,677) 2,072 (70) 184,907 297,183 143 297,326 Loss for the year (4,726) (4,726) (14) (4,740) Other comprehensive (loss)/ income for the year (16,389) 168 (16,221) (9) (16,230) Total comprehensive (loss) income for the year (16,389) 168 (4,726) (20,947) (23) (20,970) Transfer to general reserve 32(a) 75 (75) Final and special dividend relating to 2014 paid 33 (21,757) (21,757) (21,757) Interim and special dividend relating to 2015 paid 33 (12,445) (12,445) (12,445) Total transactions with owners, recognised directly in equity 75 (34,277) (34,202) (34,202) Balance at 31 December 2015 155,951 (62,066) 2,147 98 145,904 242,034 120 242,154 The accompanying notes form an integral part of these financial statements.Specimen Financial Statements: Delfi Limited C-5 CONSOLIDATED STATEMENT OF CASH FLOWS FOR THE FINANCIAL YEAR ENDED 31 DECEMBER 2016 Note 2016 2015 US$'000 US$'000 Cash flows from operating activities Total profit/(loss) 26,153 (4,740) Adjustments: Income tax expense 8(a) 13,082 12,126 Depreciation and amortisation 9,177 7,584 Property, plant and equipment written off 73 124 Impairment loss on brands 265 Gain on disposal of property, plant and equipment (104) (1,470) Exceptional items 10 2,000 20,066 Interest income (3,918) (2,053) Interest expense 4,088 4,219 Fair value loss on derivatives 63 64 Share of results of associated companies 266 (64) Operating cash flow before working capital changes 50,880 36,121 Changes in working capital Inventories 4,907 13,158 Trade and other receivables (2,889) 27,893 Trade and other payables 16,293 (16,246) Cash generated from operations 69,191 60,926 Interest received 3,918 2,053 Income tax paid (13,454 (19,731) Net cash provided by operating activities 59,655 43,248 Cash flows from investing activities Purchases of property, plant and equipment (16,674) (23,479) Payments for patents and trademarks (691) (341) Payment for final settlement of dispute 10 (38,800) Proceeds from disposal of property, plant and equipment 315 1,530 Net cash used in investing activities (17,050) (61,090) Cash flows from financing activities Capital reduction 30 (60,015) Proceeds from bank borrowings 22,836 Proceeds from/(repayment of) trade finance 114 (4,613) Repayment of bank borrowings (22,044) (7,113) Repayment of lease liabilities (2,802) (5,200) Interest paid (4,088) (4,232) Dividends paid to equity holders of the Company (8,275) (34,202) Net cash used in financing activities 97,110 (32,524) Net decrease in cash and cash equivalents (54,505) (50,366) Cash and cash equivalents Beginning of financial year 12 100,550 149,212 Effects of currency translation on cash and cash equivalents (810 1,704 End of financial year 12 45,235 100,550 The accompanying notes form an integral part of these financial statements
Step by Step Solution
There are 3 Steps involved in it
1 Expert Approved Answer
Step: 1 Unlock
Question Has Been Solved by an Expert!
Get step-by-step solutions from verified subject matter experts
Step: 2 Unlock
Step: 3 Unlock
Students Have Also Explored These Related Accounting Questions!