

Question: Comparative Balance Sheets Current Year Prior Year Source/Use Assets 78,000.00 603,000.00 1,254,000.00 86,400.00 526,800.00 1,072,800.00 1,935,000.00 1,686,000.00 (8,400.00) Account Receivable Inventory 181,200.00 U Total Current
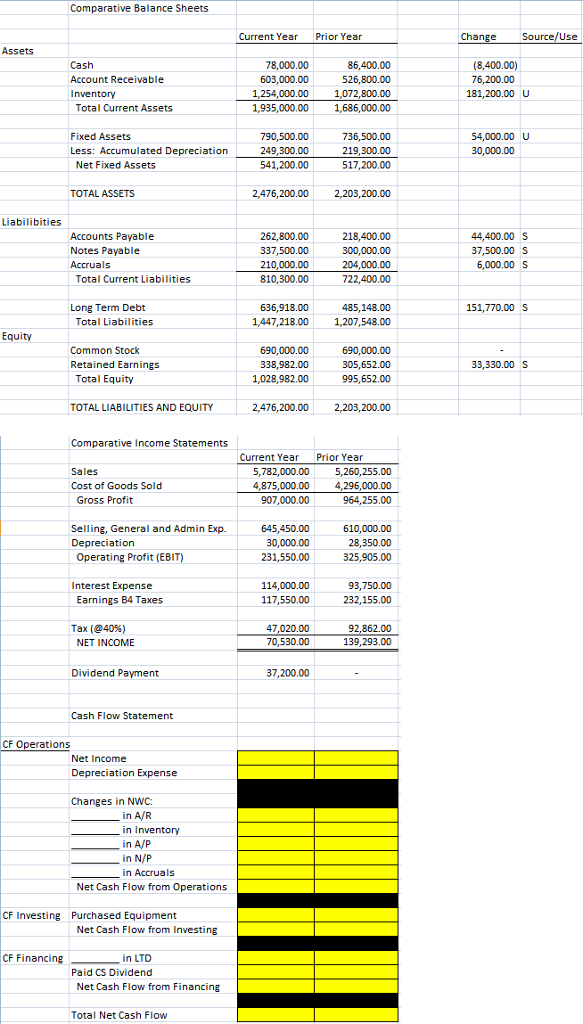
Comparative Balance Sheets Current Year Prior Year Source/Use Assets 78,000.00 603,000.00 1,254,000.00 86,400.00 526,800.00 1,072,800.00 1,935,000.00 1,686,000.00 (8,400.00) Account Receivable Inventory 181,200.00 U Total Current Assets Fixed Assets 736,500.00 219,300.00 517,200.00 54,000.00 U 30,000.00 Less: Accumulated Depreciation 249,300.00 541,200.00 Net Fixed Assets TOTAL ASSETS 2,476,200.00 2,203,200.00 Liabilibities Accounts Payable Notes Payable Accruals 262,800.00 337,500.00 210,000.00 810,300.00 218,400.00 00,000.00 204,000.00 722,400.00 44,400.00 S 37,500.00 S 6,000.00 S Total Current Liabilities Long Term Debt 485,148.00 1,447218.00 1,207,548.00 636,918.00 151,770.00 S Total Liabilities Common Stock Retained Earnings 690,000.00 338,982.00 1,028,982.00 690,000.00 305,652.00 995,652.00 Total Equity TOTAL LIABILITIES AND EQUITY 2,476,200.00 2,203,200.00 Comparative Income Statements Current Year Prior Year Sales 5,782,000.005,260,255.00 4,296,000.00 964,255.00 Cost of Goods Sold 4,875,000.00 907,000.00 Gross Profit Selling, General and Admin Exp. Depreciation 645,450.00 30,000.00 231,550.00 28,350.00 325,905.00 Operating Profit (EBIT) Interest Expense 114,000.00 93,750.00 232,155.00 arnings B4 Taxes 117,550.00 47,020.00 70,530.00 92,862.00 139,293.00 Tax (@40%) NET INCOME Dividend Payment 37,200.00 Cash Flow Statement CF Operations Net Income Depreciation Expense Changes in NWC in Inventory in Accruals Net Cash Flow from Operations CF Investing Purchased Equipment Net Cash Flow from Investing CF Financing in LTD Paid CS Dividend Net Cash Flow from Financing Total Net Cash Flow
Step by Step Solution
There are 3 Steps involved in it

Get step-by-step solutions from verified subject matter experts