

Question: Comparative figures for Apple and Google follow. Apple Google $ millions Accounts receivable, net Net sales Current One Year Two Years Year Prior Prior $
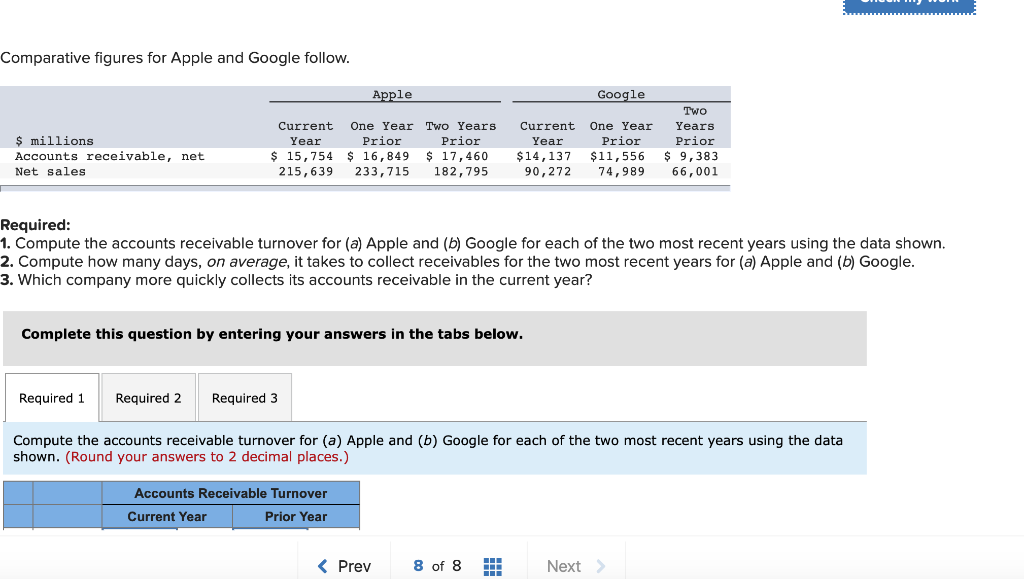
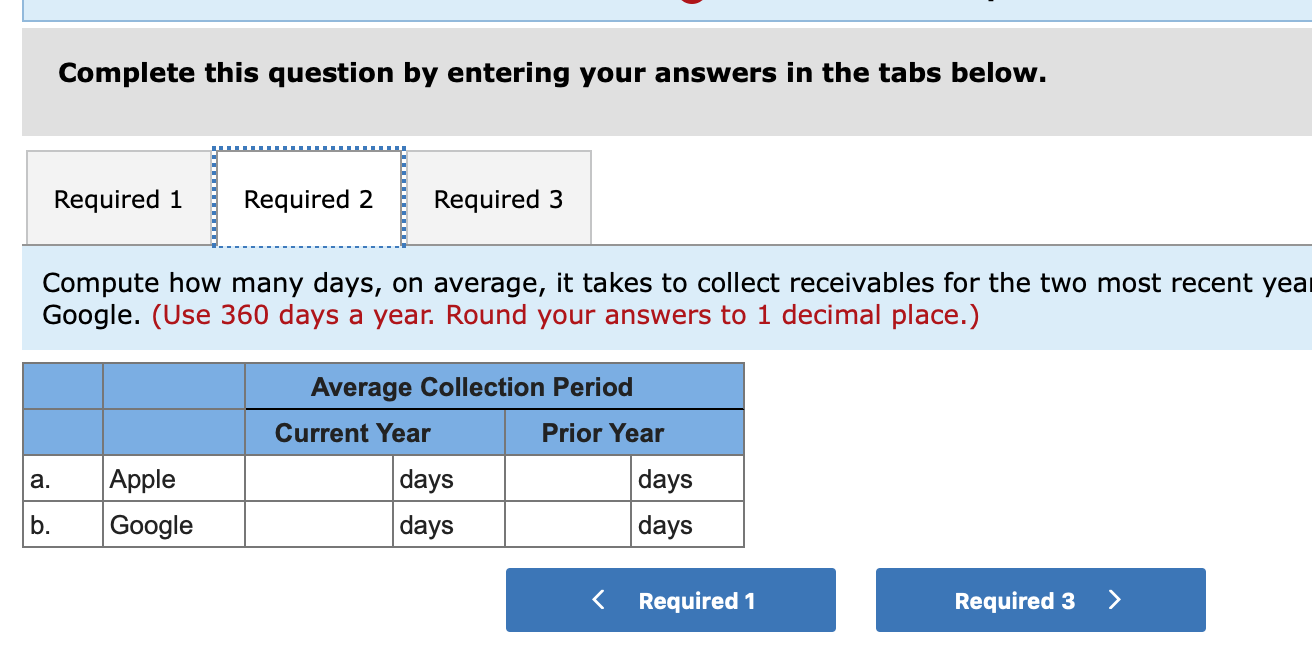
Comparative figures for Apple and Google follow. Apple Google $ millions Accounts receivable, net Net sales Current One Year Two Years Year Prior Prior $ 15,754 $ 16,849 $ 17,460 215,639 233,715 182,795 Current One Year Year Prior $14,137 $11,556 9 0,272 74,989 TWO Years Prior $ 9,383 66,001 Required: 1. Compute the accounts receivable turnover for (a) Apple and (b) Google for each of the two most recent years using the data shown. 2. Compute how many days, on average, it takes to collect receivables for the two most recent years for (a) Apple and (b) Google. 3. Which company more quickly collects its accounts receivable in the current year? Complete this question by entering your answers in the tabs below. Required 1 Required 2 Required 3 Compute the accounts receivable turnover for (a) Apple and (b) Google for each of the two most recent years using the data shown. (Round your answers to 2 decimal places.) Accounts Receivable Turnover Current Year Prior Year Complete this question by entering your answers in the tabs below. Required 1 Required 2 Required 3 Compute how many days, on average, it takes to collect receivables for the two most recent year Google. (Use 360 days a year. Round your answers to 1 decimal place.) Average Collection Period Current Year Prior Year days days days days Apple Google b.
Step by Step Solution
There are 3 Steps involved in it

Get step-by-step solutions from verified subject matter experts