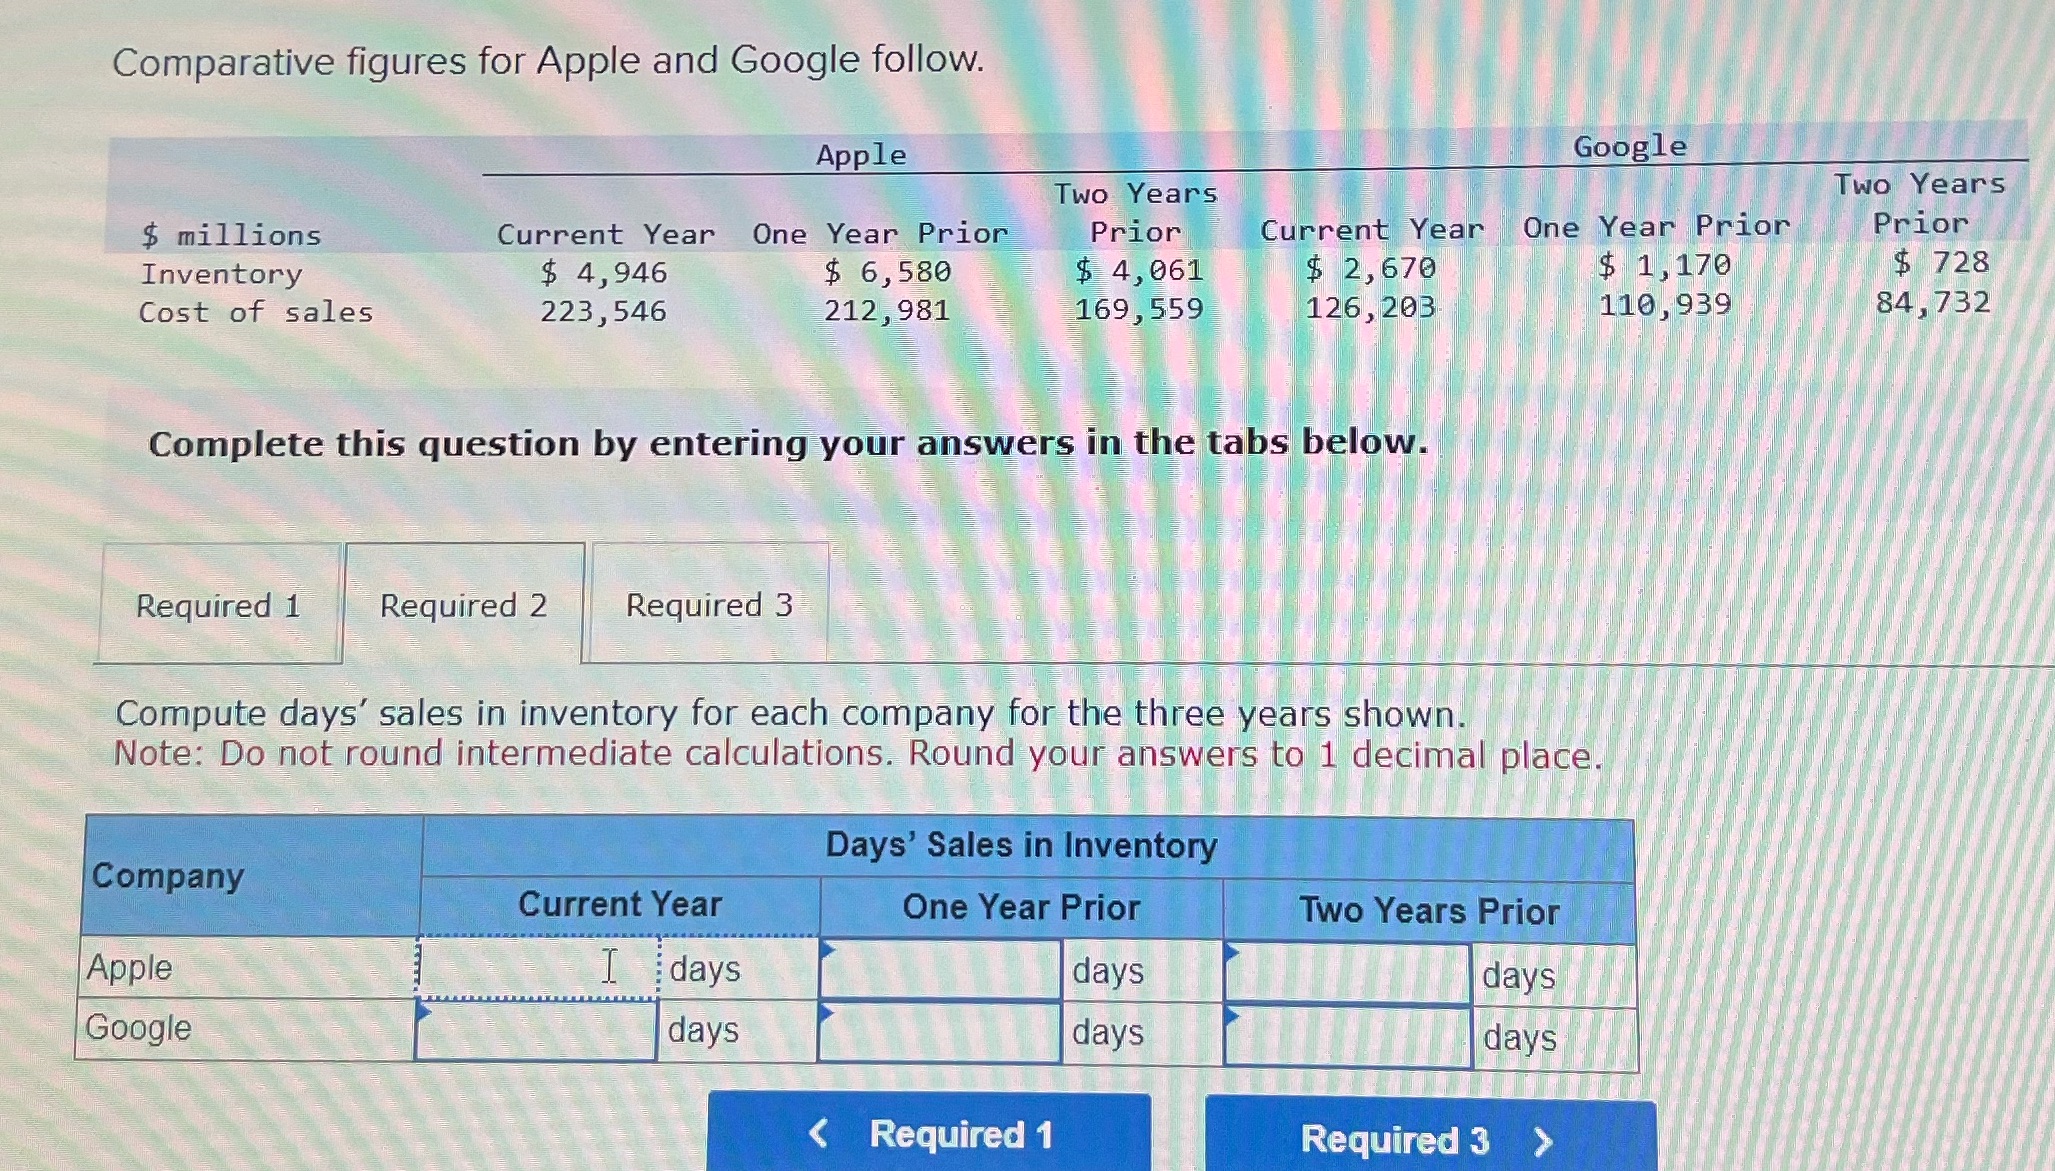
Question: Comparative figures for Apple and Google follow. Apple Google Two Years Two Years $ millions Current Year One Year Prior Prior Current Year One Year

Comparative figures for Apple and Google follow.
Comparative figures for Apple and Google follow. Apple Google Two Years Two Years $ millions Current Year One Year Prior Prior Current Year One Year Prior Prior Inventory $ 4, 946 $ 6,580 $ 4, 061 $ 2, 670 $ 1, 170 $ 728 Cost of sales 223, 546 212, 981 169, 559 126, 203 110, 939 84, 732 Complete this question by entering your answers in the tabs below. Required 1 Required 2 Required 3 Compute days' sales in inventory for each company for the three years shown. Note: Do not round intermediate calculations. Round your answers to 1 decimal place. Days' Sales in Inventory Company Current Year One Year Prior Two Years Prior Apple I days days days Google days days days

Step by Step Solution

There are 3 Steps involved in it

1 Expert Approved Answer
Step: 1 Unlock blur-text-image
Question Has Been Solved by an Expert!

Get step-by-step solutions from verified subject matter experts

Step: 2 Unlock
Step: 3 Unlock

Students Have Also Explored These Related Accounting Questions!