

Question: Comparative financial statement data for Bridgeport Corp. and Sarasota Corp., two competitors, appear below. All balance sheet data are as of December 31, 2025. Net
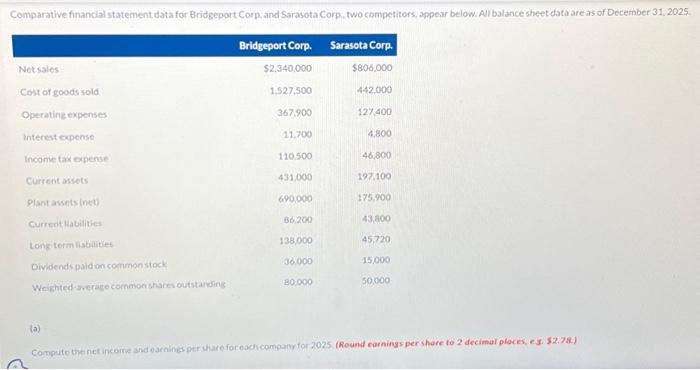
Comparative financial statement data for Bridgeport Corp. and Sarasota Corp., two competitors, appear below. All balance sheet data are as of December 31, 2025. Net sales Cost of goods sold Operating expenses Interest expense Income tax expense Current assets Plant assets (net) Current liabilities Long-term liabilities Dividends paid on common stock Weighted-average common shares outstanding (a) Bridgeport Corp. $2,340,000 1,527,500 367,900 11,700 110,500 431,000 690,000 86,200 138,000 36,000 80,000 Sarasota Corp. $806,000 442,000 127,400 4,800 46,800 197.100 175.900 43,800 45,720 15,000 50.000 Compute the net income and earnings per share for each company for 2025. (Round earnings per share to 2 decimal places, e.g. $2.78.)
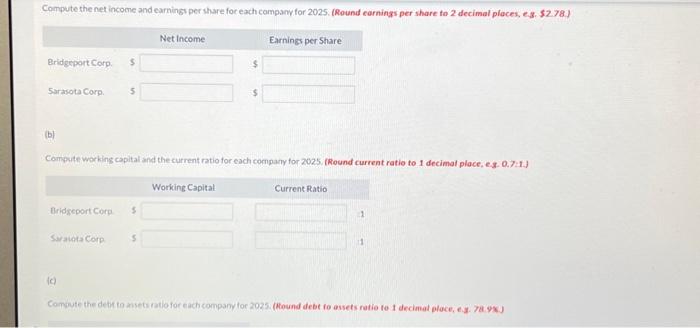
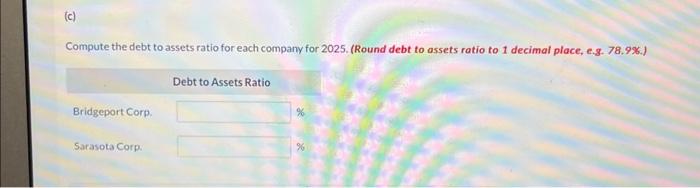
(a) Comput the net incorre and earnings per shure for eachicompany for 2025. (Round carnings per share to 2 decimul places, e3. 52.78.) Compute working capital and the current ratio for each company for 2025 , (Round current ratio to 1 decimal place, eg. 0.7:1.) (c) Compute the debt to assets ratio for each company for 2025. (Round debt to assets ratio to 1 decimal place, e.g. 78.9\%.)
Step by Step Solution
There are 3 Steps involved in it
1 Expert Approved Answer
Step: 1 Unlock

Question Has Been Solved by an Expert!
Get step-by-step solutions from verified subject matter experts
Step: 2 Unlock
Step: 3 Unlock