

Question: Comparative financial statement data for Cheyenne Corp, and Ayayai Corp., two competitors, appear below. All balance sheet data are as of December 31, 2022 Cheyenne
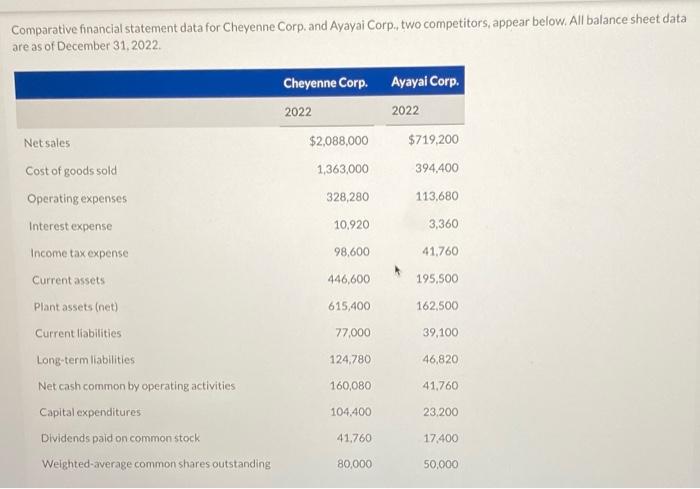
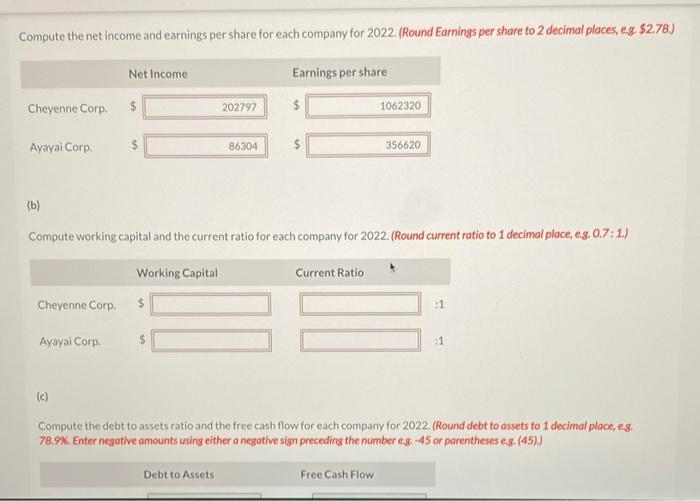
Comparative financial statement data for Cheyenne Corp, and Ayayai Corp., two competitors, appear below. All balance sheet data are as of December 31, 2022 Cheyenne Corp. Ayayal Corp. 2022 2022 $2,088,000 $719,200 1,363,000 394,400 Netsales Cost of goods sold Operating expenses 328,280 113,680 Interest expense 10,920 3,360 98,600 41.760 Income tax expense Current assets Plant assets (net) 446,600 195,500 615,400 162,500 Current liabilities 77,000 39,100 Long-term liabilities 124.780 46,820 160,080 41,760 Net cash common by operating activities Capital expenditures 104.400 23.200 Dividends paid on common stock 41.760 17.400 Weighted average common shares outstanding 80,000 50,000 Compute the net income and earnings per share for each company for 2022. (Round Earnings per share to 2 decimal places, eg. $2.78.) Net Income Earnings per share Cheyenne Corp $ 202797 $ 1062320 Ayayai Corp. 86304 $ 356620 (b) Compute working capital and the current ratio for each company for 2022. (Round current ratio to 1 decimal place, es. 0.7:1.) Working Capital Current Ratio Cheyenne Corp, :1 Ayayal Corp $ :1 (c) Compute the debt to assets ratio and the free cash flow for each company for 2022. (Round debt to assets to 1 decimal place, es 78.9%. Enter negative amounts using either a negative sign preceding the number e.g. -45 or parentheses es. (45)) Debt to Assets Free Cash Flow
Step by Step Solution
There are 3 Steps involved in it

Get step-by-step solutions from verified subject matter experts