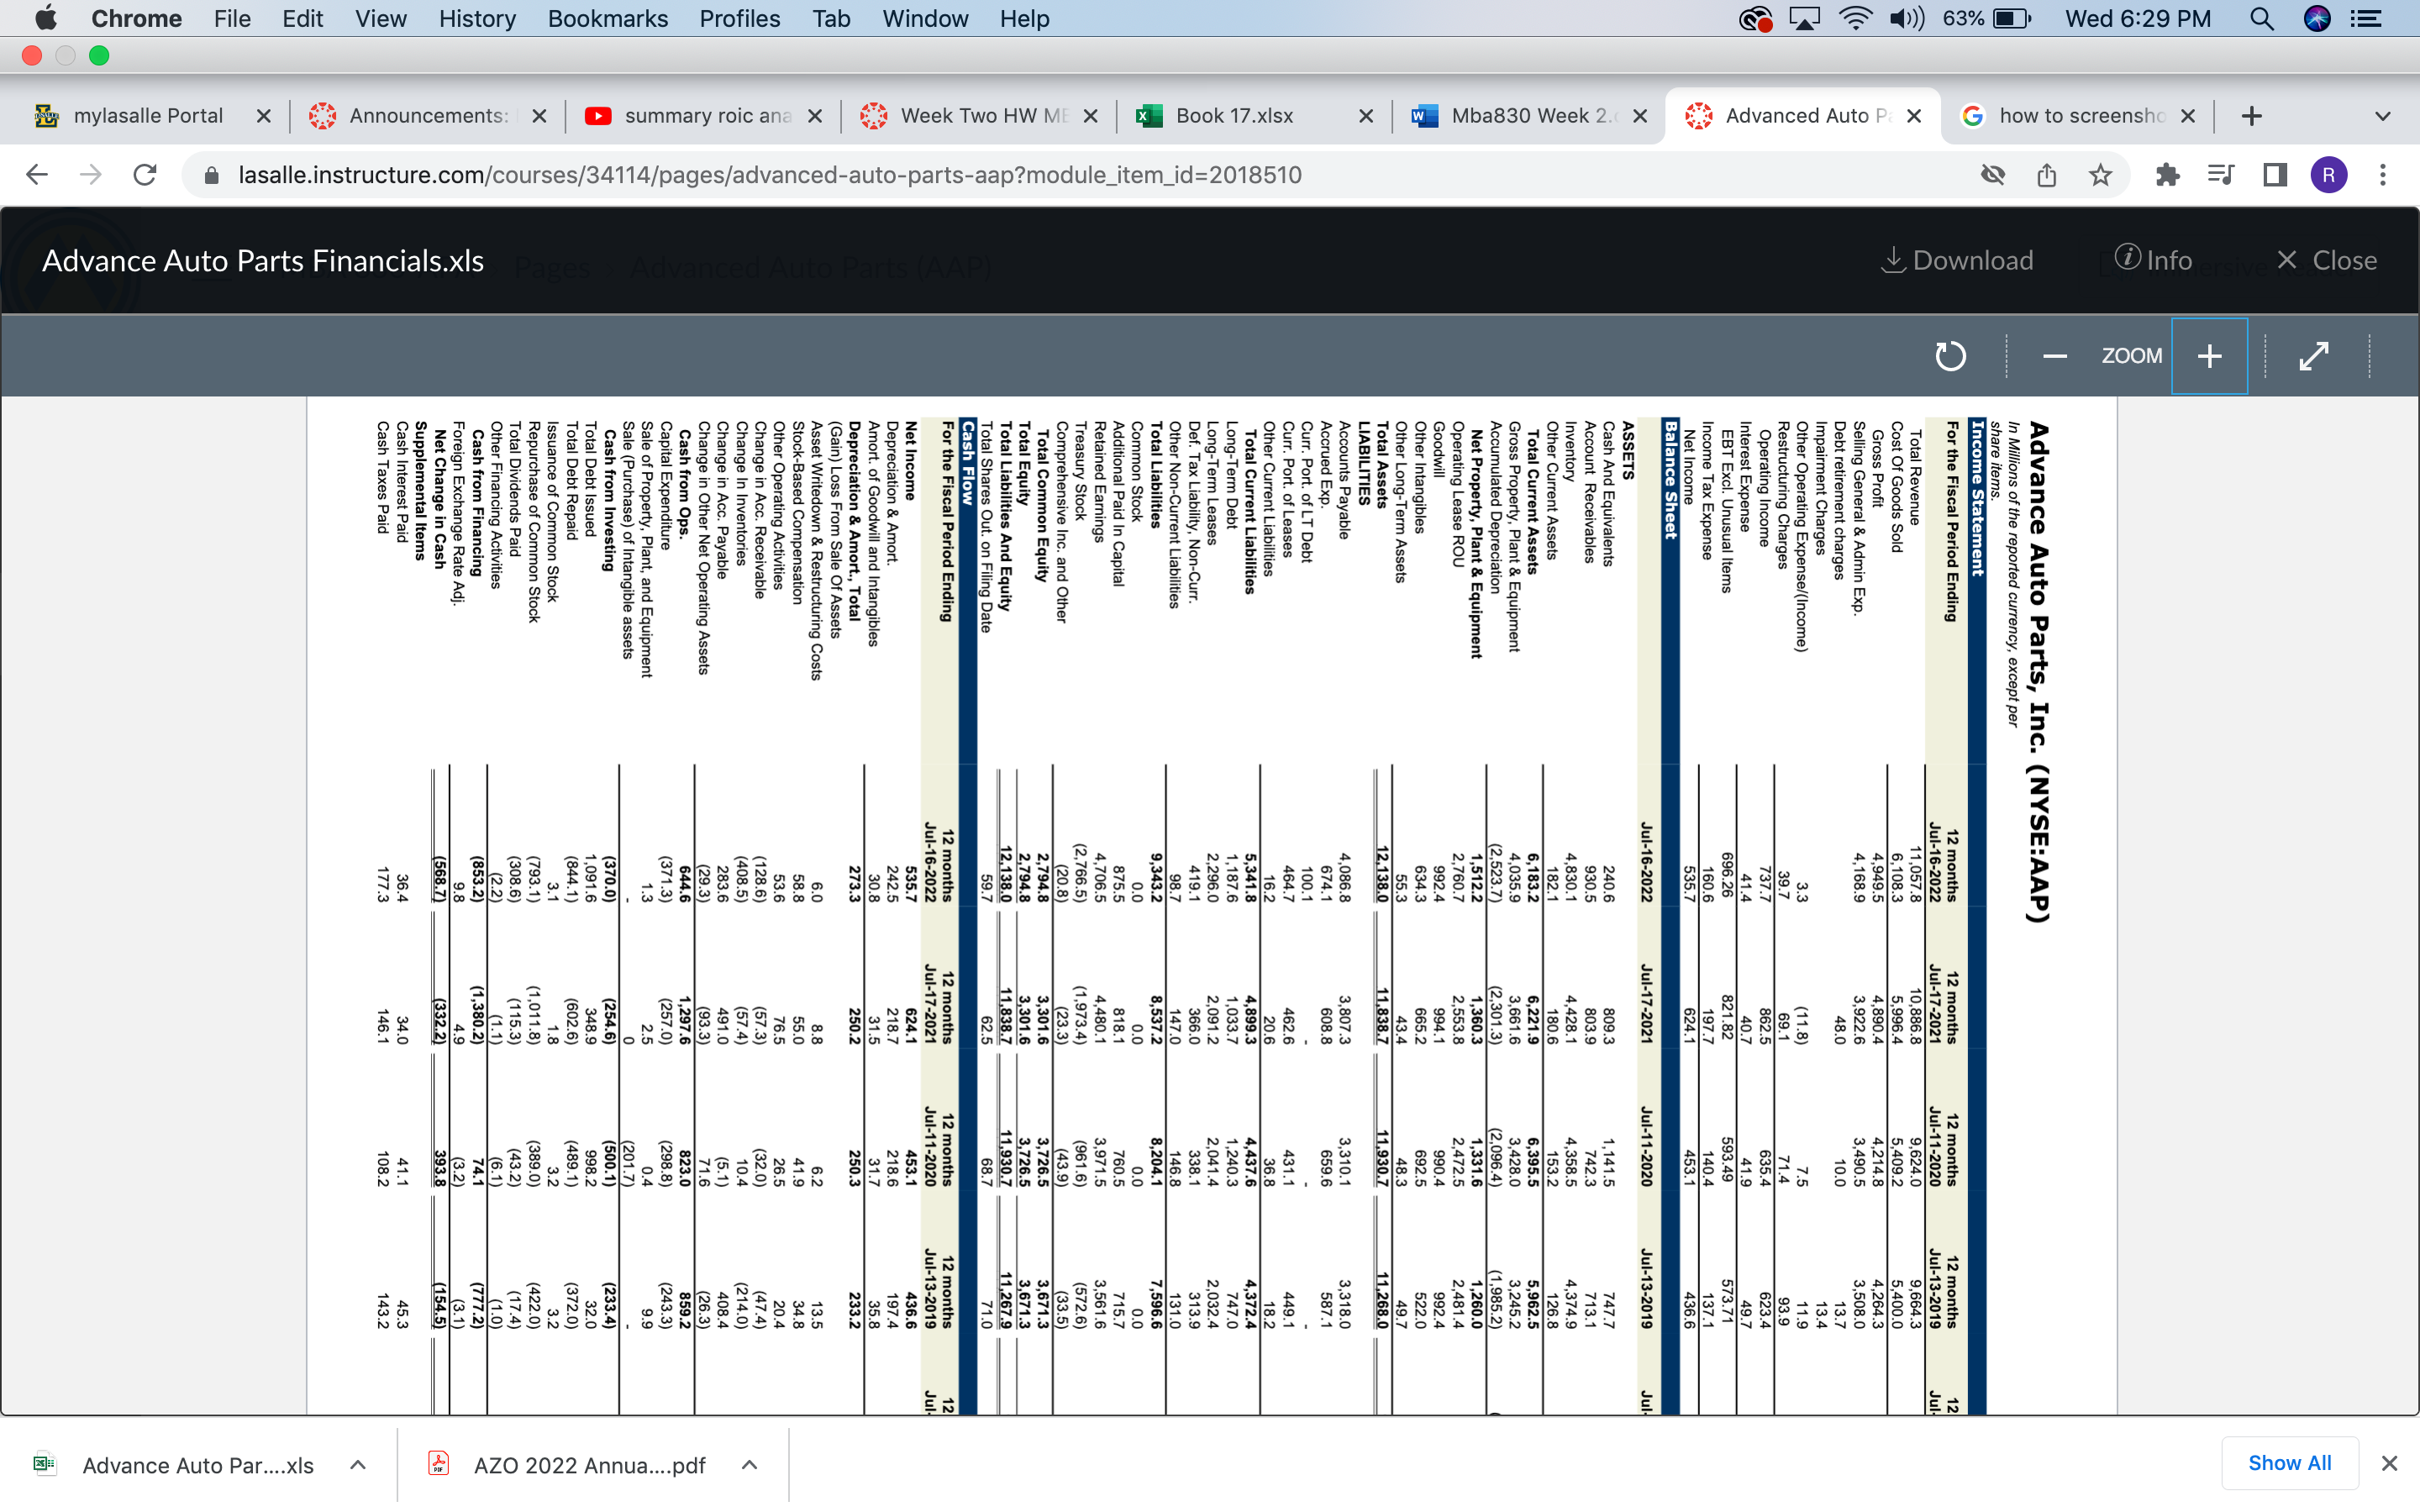
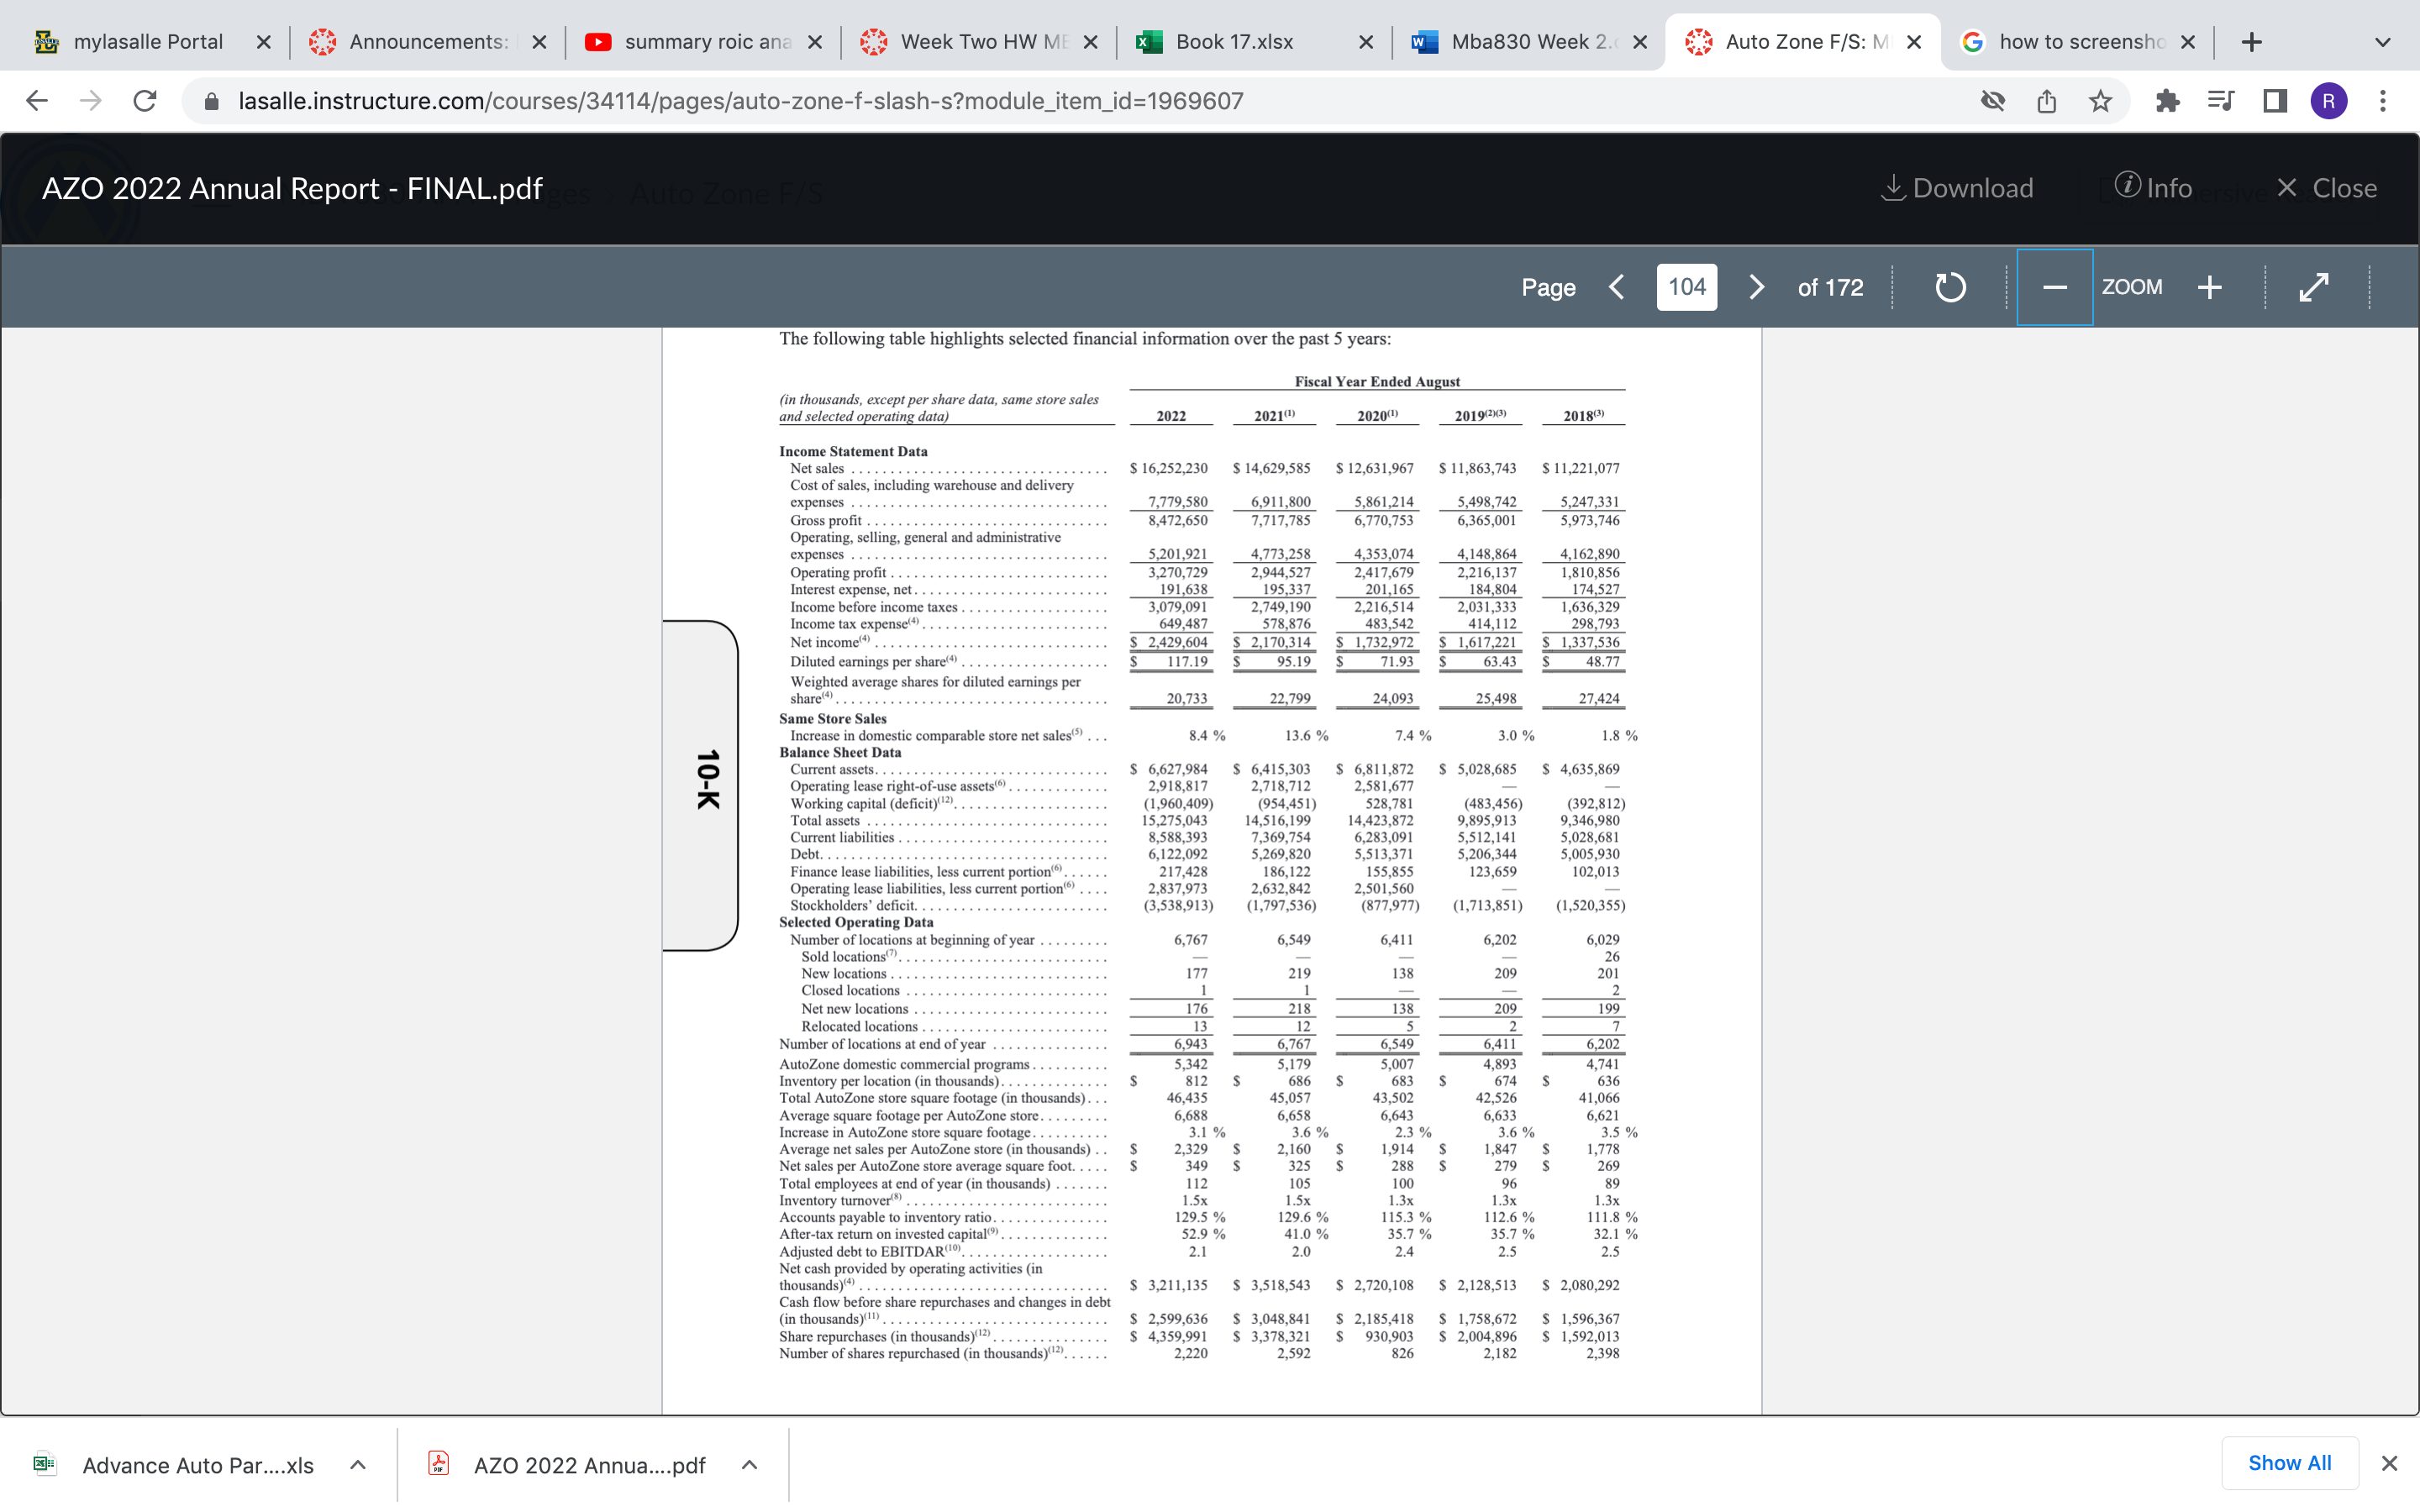
Question: compare and contrast operating ratio analysis of the operating performance for these two firms for years 2018-2022. (Autozone & Advanced Auto Parts) use year-end data
compare and contrast operating ratio analysis of the operating performance for these two firms for years 2018-2022. (Autozone & Advanced Auto Parts)
use year-end data for ratio calculations and use a 25% tax rate.
Organize and present your operating performance analysis in a memo with embedded graphs/tables that add clarity to your analysis. Memos should include both descriptive information (what happened) and analytical insights (why). Based upon your analysis what and why are your investment recommendations?
Organize following the logic discussed in the text and the recordings.
For 2019 use ROU assets & debt of $1.9 billion for AZO. For 2018 use ROU assets & debt of $1.6 billion for AZO.
X X Close Show All + @ Info WOOZ G how to screensho x + - Advance Auto Parts, Inc. (NYSE:AAP) In Millions of the reported currency, except per share items. 63% Wed 6:29 PM Income Statement & Download Q For the Fiscal Period Ending 12 months 12 months 12 months 12 months ul-16-2022 ul-17-2021 Jul-11-2020 Jul-13-2019 Total Revenue 11,057.8 10 ,8 86.8 9.624.0 Cost Of Goods Sold 9.664.3 6,108.3 Gross Profit 5,996.4 5,409.2 5,400.0 4,949.5 Selling General & Admin Exp. 4,890.4 4,214.8 ,264.3 4. 168 9 3.922.6 3.490.5 Debt retirement charges 3,508.0 48.0 10.0 Impairment Charges 13.7 13.4 Advanced Auto P: X Other Operating Expense/(Income) Restructuring Charges 3.3 (11.8) 7.5 11.9 39.7 69.1 Operating Income 71.4 737.7 93.9 862.5 635.4 623.4 Interest Expense 41.4 40.7 41.9 EBT Excl Unusual Items 49.7 $96.26 321.82 593.49 ncome Tax Expense 573.71 Net Income 160.6 197.7 140.4 137.1 535.7 524.1 453.1 436.6 Balance Sheet Jul-16-2022 Jul-17-2021 ASSETS Jul-11-2020 Jul-13-2019 Jul Cash And Equivalents 240.6 809.3 Account Receivables ,141.5 747.7 930.5 803.9 742.3 713.1 Inventory Other Current Assets ,830.1 ,428.1 182.1 1,358.5 4,374.9 180.6 153.2 126.8 Total Current Assets 6,183.2 6,221.9 6,395.5 Gross Property, Plant & Equipment ,962.5 X w Mba830 Week 2.( X 4,035.9 Accumulated Depreciation 3,661.6 3,428.0 3,245.2 2,523.7) 2,301.3) 2,096.4) 1,985.2) Net Property, Plant & Equipment 1,512.2 Operating Lease ROU 1,360.3 1,331.6 1,260.0 ,760. 2,553.8 472 5 Goodwill 992.4 994 1 Other Intangibles 990.4 992 4 634.3 65.2 Other Long-Term Assets 692.5 $22.0 55.3 43.4 Total Assets 48.3 49.7 12.138.0 11.838.7 930.7 LIABILITIES 11,268.0 Accounts Payable 4,086.8 3,807.3 Accrued Exp. 3.310.1 3,318.0 674.1 608.8 659.6 587 1 Curr. Port. of LT Debt 100.1 Curr. Port. of Leases 464.7 62.6 431.1 449.1 Other Current Liabilities 16.2 20.6 Total Current Liabilities 36 .8 18.2 5,341.8 4,899.3 Long-Term Debt 4,437.6 1,187.6 1,033.7 4,372.4 1,240.3 747.0 Long-Term Leases ,296.0 2,091.2 ,041.4 2,032.4 X x Book 17.xIsx Def. Tax Liability, Non-Curr. 419.1 366.0 338.1 313 9 Other Non-Current Liabilities 98.7 147.0 146.8 Total Liabilities 131.0 ,343.2 8,537.2 Common Stock 8,204.1 7.596.6 0.0 0.0 0.0 0.0 Additional Paid In Capital Retained Earnings 875.5 818.1 760.5 715.7 4,706.5 4,480.1 3,971.5 Treasury Stock 3,561.6 (2,766.5) 1,973.4) Comprehensive Inc. and Other 961.6) (572.6) (20.8) (23.3) Total Common Equity (43.9) (33.5) ,794.8 3,301.6 Total Equity 3,726.5 3 671 3 2,794.8 3,301.6 Total Liabilities And Equity 3,726.5 3,671.3 2,138.0 1,838.7 Total Shares Out. on Filing Date 1,930.7 1,267.9 59.7 62.5 68.7 71.0 Cash Flow For the Fiscal Period Ending 12 months 12 months 12 months Jul-16-2022 12 months NE Jul-17-2021 Jul-11-2020 Jul-13-2019 Net Income 535.7 624.1 453.1 436.6 Depreciation & Amort. 242.5 218.7 218.6 197.4 Amort. of Goodwill and Intangibles 30.8 31.5 31.7 35.8 Depreciation & Amort., Total 273.3 250.2 250.3 2327 (Gain) Loss From Sale Of Assets Asset Writedown & Restructuring Costs Stock-Based Compensation 6.0 8.8 6.2 13.5 Other Ope 58.8 $5.0 41.9 34.8 erating Activities 53.6 76.5 26.5 Change in Acc. Receivable 20.4 (128.6) (57.3) Change In Inventories (32.0) (47.4) 408.5) (57.4) 10.4 214.0) V Change in Acc. Payable 283.6 491.0 Change in Other Net Operating Assets (5.1) 408.4 Cash from Ops. (29.3) (93.3) 71.6 (26.3) 644.6 1,297.6 823 .0 859 7 - > C a lasalle.instructure.com/courses/34114/pages/advanced-auto-parts-aap?module_item_id=2018510 Capital Expenditure (371.3) 257.0) 243.3) Sale of Property, Plant, and Equipment 1.3 298.8) 2.5 0.4 9.9 Sale (Purchase) of Intangible assets Cash from Investing 201.7 ) (370.0) 254.6) Total Debt Issued 500.1) 233.4) 1,091.6 348.9 998.2 mylasalle Portal X Announcements: X summary roic ana x Week Two HW ME X Total Debt Repaid 32.0 AZO 2022 Annua....pdf Chrome File Edit View History Bookmarks Profiles Tab Window Help (844.1) 602.6) 489.1) Issuance of Common Stock 372.0) 3.1 Repurchase of Common Stock 1.8 3.2 3.2 793.1) (1,011.8) Total Dividends Paid 389.0) 422.0) 308.6) (115.3) (43.2) Other Financing Activities (17.4) (2.2 Cash from Financing (1.1) (6.1) (1.0) 853.2) 1,380.2) 74.1 777.2) Foreign Exchange Rate Adj. 9.8 4.9 Net Change in Cash (3.2) (3.1 ) (568.7) (332.2) 393.8 Supplemental Items (154.5) Cash Interest Paid 36.4 Cash Taxes Paid 34.0 41.1 177.3 45.3 146.1 108.2 143.2 V Advance Auto Parts Financials.xIs Advance Auto Par....xIsmylasalle Portal X Announcements: X summary roic ana X Week Two HW ME X * Book 17.xIsx X w Mba830 Week 2.( X Auto Zone F/S: M X G how to screensho x + A lasalle.instructure.com/courses/34114/pages/auto-zone-f-slash-s?module_item_id=1969607 AZO 2022 Annual Report - FINAL.pdf Download i Info X Close Page 104 of 172 ZOOM + The following table highlights selected financial information over the past 5 years: Fiscal Year Ended August (in thousands, except per share data, same store sales and selected operating data) 2022 20210) 2020() 2019()3) 20180) Income Statement Data Net sales . $ 16,252,230 $ 14,629,585 $ 12,631,967 $ 11,863,743 $ 11,221,077 Cost of sales, including warehouse and delivery expenses .. 7,779,580 6,911,800 5,861,214 5,498,742 5,247,331 Gross profit . .. 8,472,650 7,717,785 6,770,753 6,365,001 5,973,746 Operating, selling, gen administrative expenses . . 5,201,921 4,773,258 4,353,074 4,148,864 4,162,890 Operating profit . . . 3,270,729 2,944,527 2,417,679 2,216,137 1,810,856 Interest expense, net . . 191,638 195,337 201,165 184,804 174,527 Income before income taxes ,079.091 2,749,190 2,216,514 2,031,333 1,636,329 Income tax expense(4) . . 649,487 578,876 483,542 414,112 298,793 Net income(4) . . $ 2,429,604 S 2,170,314 $ 1,732,972 $ 1,617,221 S 1,337,536 Diluted earnings per share(4) . 117.19 95.19 71.93 63.43 48.77 Weighted average shares for diluted earnings per share" . . . . . . . . . . . . . . 20,733 22,79 24,093 25,498 27,424 Same Store Sales Increase in domestic comparable store net sales). . . 8.4% 13.6 % 7.4 % 3.0 % 1.8% Balance Sheet Data Current assets. .. . . . $ 6,627,984 $ 6,415,303 $ 6,811,872 $ 5,028,685 $ 4,635,869 10-K Operating lease right-of-use assets() 2,918,817 2,718,712 2,581,677 Working capital (deficit)(12). . (1,960,409) (954,451) 528,781 (483,456) (392,812) Total assets . . 15,275,043 4,516,199 4,423,872 ,895,913 9,346,980 Current liabili 8,588,393 7,369,754 6,283,091 5,512,141 5,028,681 Debt. . ,122,092 5,269,820 ,513,371 5,206,344 5,005,930 Finance lease liabilities, less current portion). . 217,428 186,122 155,855 23,659 102,013 Operating lease liabilities, less current portion() . . 2,837,973 2,632,842 2,501,560 Stockholders' deficit. . . . . . . . . . . . (3,538,913) (1,797,536) (877,977) (1,713,851) (1,520,355) Selected Operating Data Number of locations at beginning of year . . 6,767 6,549 6,411 6,202 6,029 Sold locations. . New locations . . 219 138 209 Closed locations . Net new locations . 176 138 209 199 Relocated locations 13 12 7 Number of locations at end of year . 6,943 6,767 6,549 6,411 6,202 AutoZone domestic commercial programs 3.342 5,179 5,007 4,893 4,741 Inventory per location (in thousands). . S 812 S 686 S 683 674 636 Total AutoZone store square footage (in thousands) . . 16,435 45,057 43,202 42,526 41,066 Average square footage per AutoZone store 6.688 6,658 6.643 6,633 6,621 Increase in AutoZone store square footage. 3.1 % 3.6 % 3.6 % 3.5 % Average net sales per AutoZone store (in thousands) . . 2,329 S 2,160 S 1,914 S 1,847 S 1.778 AutoZone store average square foot. . . . . 349 225 288 279 269 Total employees at end of year (in thousands) . . . . 105 89 Inventory turnover() . . 1.5x 1.5x 1.3x 1.3x Accounts payable to inventory ratio. 129.5 % 129.6 70 115.5 70 112.6 % 11.8 70 After-tax return on invested capital"). 52.9 % 41 0 % 35.7 % 35.7% 32.1 % Adjusted debt to EBITDAR(10). . . 2.1 20 24 25 2.5 Net cash provided by operating activities (in thousands) (4) .. $ 3,211,135 $ 3,518,543 $ 2,720,108 $ 2,128,513 $ 2,080,292 Cash flow before share repurchases and changes in debt (in thousands)(ID) . . . $ 2,599,636 $ 3,048,841 $ 2,185,418 $ 1,758,672 $ 1,596,367 Share repurchases (in thousands) (12) . . $ 4,359,991 $ 3,378,321 $ 930,903 $ 2,004,896 Number of shares repurchased (in thousands)(12). . . 2,220 2,592 826 2,182 2,398 Advance Auto Par....xIs AZO 2022 Annua....pdf Show All X
Step by Step Solution
There are 3 Steps involved in it
1 Expert Approved Answer
Step: 1 Unlock
Question Has Been Solved by an Expert!
Get step-by-step solutions from verified subject matter experts
Step: 2 Unlock
Step: 3 Unlock
Students Have Also Explored These Related Accounting Questions!